|
Size: 7937
Comment:
|
Size: 8936
Comment:
|
| Deletions are marked like this. | Additions are marked like this. |
| Line 35: | Line 35: |
| s2str = '' for x in s2f: s2str += wave.struct.pack('h',x) |
s2str = ''.join(wave.struct.pack('h',x) for x in s2f) |
| Line 62: | Line 60: |
| XY = X.intersection(Y) XZ = X.intersection(Z) YZ = Y.intersection(Z) XYZ = XY.intersection(Z) |
XY = X & Y XZ = X & Z YZ = Y & Z XYZ = XY & Z |
| Line 92: | Line 90: |
| Z = set(S[i]).intersection(S[(i+1)%3]).difference(set(XYZ)) | Z = (set(S[i]) & S[(i+1)%3]) - set(XYZ) |
| Line 228: | Line 226: |
| edge_lines = edge_lines + line([verts[an_edge[0]], verts[an_edge[1][0]]]) edge_lines = edge_lines + line([verts[an_edge[0]], verts[an_edge[1][1]]]) |
edge_lines += line([verts[an_edge[0]], verts[an_edge[1][0]]]) edge_lines += line([verts[an_edge[0]], verts[an_edge[1][1]]]) |
| Line 235: | Line 233: |
| triangle_sum = triangle_sum + polygon(temp_list, alpha = .5, rgbcolor = (1,0,0)) | triangle_sum += polygon(temp_list, alpha = .5, rgbcolor = (1,0,0)) |
| Line 241: | Line 239: |
| kite_sum = kite_sum + polygon(temp_list, alpha = .3,rgbcolor = (0,0,1)) | kite_sum += polygon(temp_list, alpha = .3,rgbcolor = (0,0,1)) |
| Line 243: | Line 241: |
| labels = labels + text('=', (-.2,.5), rgbcolor = (0,0,0)) | labels += text('=', (-.2,.5), rgbcolor = (0,0,0)) |
| Line 247: | Line 245: |
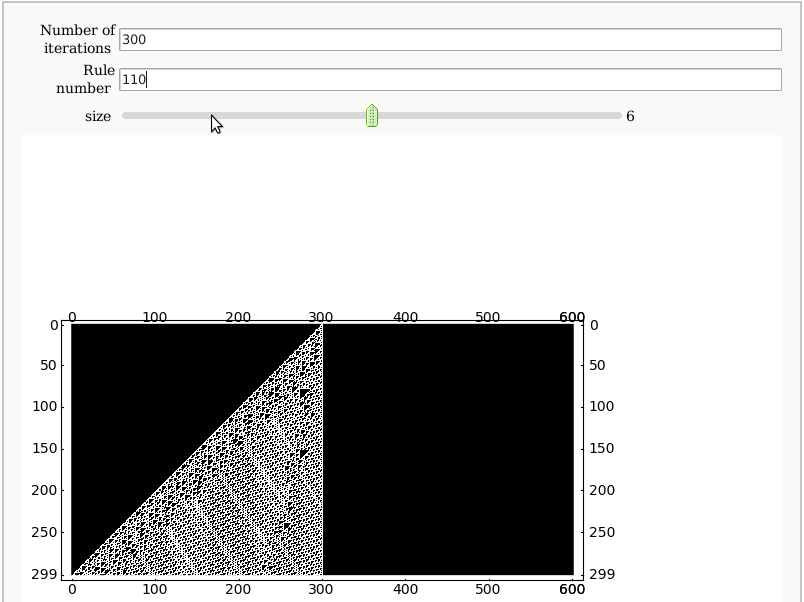
== Cellular Automata == by Pablo Angulo {{{ %cython from numpy import zeros def cellular(rule, int N): '''Yields a matrix showing the evolution of a Wolfram's cellular automaton rule: determines how a cell's value is updated, depending on its neighbors N: number of iterations ''' cdef int j,k,l M=zeros( (N,2*N+1), dtype=int) M[0,N]=1 for j in range(1,N): for k in range(N-j,N+j+1): l = 4*M[j-1,k-1] + 2*M[j-1,k] + M[j-1,k+1] M[j,k]=rule[ l ] return M }}} {{{ def num2rule(number): if not 0 <= number <= 255: raise Exception('Invalid rule number') binary_digits = number.digits(base=2) return binary_digits + [0]*(8-len(binary_digits)) @interact def _( N=input_box(label='Number of iterations',default=100), rule_number=input_box(label='Rule number',default=110), size = slider(1, 11, step_size=1, default=6 ) ): rule = num2rule(rule_number) M = cellular(rule, N) plot_M = matrix_plot(M) plot_M.show( figsize=[size,size]) }}} {{attachment:cellular.png}} |
Sage Interactions - Miscellaneous
goto interact main page
Contents
Hearing a trigonometric identity
by Marshall Hampton. When the two frequencies are well seperated, we hear the right hand side of the identity. When they start getting close, we hear the higher-pitched factor in the left-hand side modulated by the lower-pitched envelope.
import wave

class SoundFile:
   def  __init__(self, signal,lab=''):
       self.file = wave.open('./test' + lab + '.wav', 'wb')
       self.signal = signal
       self.sr = 44100

   def write(self):
       self.file.setparams((1, 2, self.sr, 44100*4, 'NONE', 'noncompressed'))
       self.file.writeframes(self.signal)
       self.file.close()

mypi = float(pi)
from math import sin

@interact
def sinsound(freq_ratio =  slider(0,1,1/144,1/12)):
    hz1 = 440.0
    hz2 = float(440.0*2^freq_ratio)
    html('$\cos(\omega t) - \cos(\omega_0 t) = 2 \sin(\\frac{\omega + \omega_0}{2}t) \sin(\\frac{\omega - \omega_0}{2}t)$')
    s2 = [sin(hz1*x*mypi*2)+sin(hz2*x*mypi*2) for x in srange(0,4,1/44100.0)]
    s2m = max(s2)
    s2f = [16384*x/s2m for x in s2]
    s2str = ''.join(wave.struct.pack('h',x) for x in s2f)
    lab="%1.2f"%float(freq_ratio)
    f = SoundFile(s2str,lab=lab)
    f.write()
    pnum = 1500+int(500/freq_ratio)
    show(list_plot(s2[0:pnum],plotjoined=True))
    html('<embed src="https:./test'+ lab +'.wav" width="200" height="100"></embed>')
    html('Frequencies: '+ '$\omega_0 = ' + str(hz1) + ' $, $\omega = '+latex(hz2) + '$')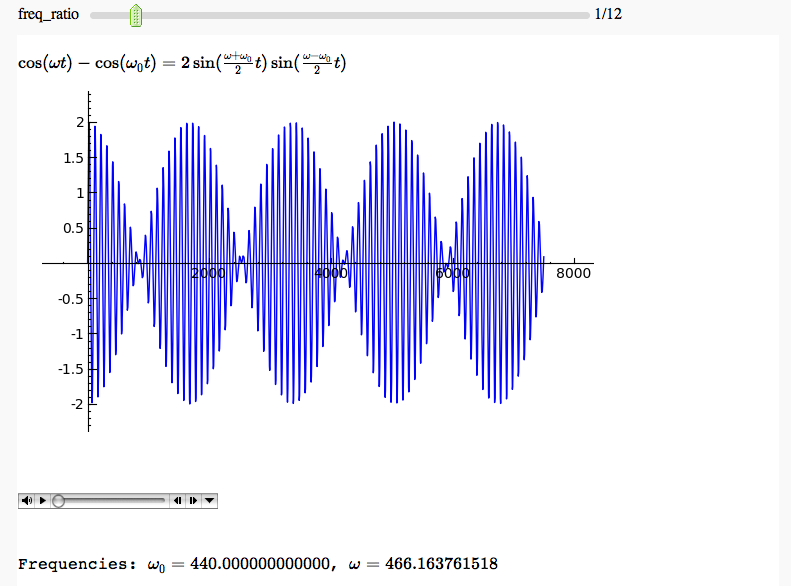
An Interactive Venn Diagram
def f(s, braces=True):
    t = ', '.join(sorted(list(s)))
    if braces: return '{' + t + '}'
    return t
def g(s): return set(str(s).replace(',',' ').split())

@interact
def _(X='1,2,3,a', Y='2,a,3,4,apple', Z='a,b,10,apple'):
    S = [g(X), g(Y), g(Z)]
    X,Y,Z = S
    XY = X & Y
    XZ = X & Z
    YZ = Y & Z
    XYZ = XY & Z
    html('<center>')
    html("$X \cap Y$ = %s"%f(XY))
    html("$X \cap Z$ = %s"%f(XZ))
    html("$Y \cap Z$ = %s"%f(YZ))
    html("$X \cap Y \cap Z$ = %s"%f(XYZ))
    html('</center>')
    centers = [(cos(n*2*pi/3), sin(n*2*pi/3)) for n in [0,1,2]]
    scale = 1.7
    clr = ['yellow', 'blue', 'green']
    G = Graphics()
    for i in range(len(S)):
        G += circle(centers[i], scale, rgbcolor=clr[i],
             fill=True, alpha=0.3)
    for i in range(len(S)):
        G += circle(centers[i], scale, rgbcolor='black')

    # Plot what is in one but neither other
    for i in range(len(S)):
        Z = set(S[i])
        for j in range(1,len(S)):
            Z = Z.difference(S[(i+j)%3])
        G += text(f(Z,braces=False), (1.5*centers[i][0],1.7*centers[i][1]), rgbcolor='black')


    # Plot pairs of intersections
    for i in range(len(S)):
        Z = (set(S[i]) & S[(i+1)%3]) - set(XYZ)
        C = (1.3*cos(i*2*pi/3 + pi/3), 1.3*sin(i*2*pi/3 + pi/3))
        G += text(f(Z,braces=False), C, rgbcolor='black')

    # Plot intersection of all three
    G += text(f(XYZ,braces=False), (0,0), rgbcolor='black')

    # Show it
    G.show(aspect_ratio=1, axes=False)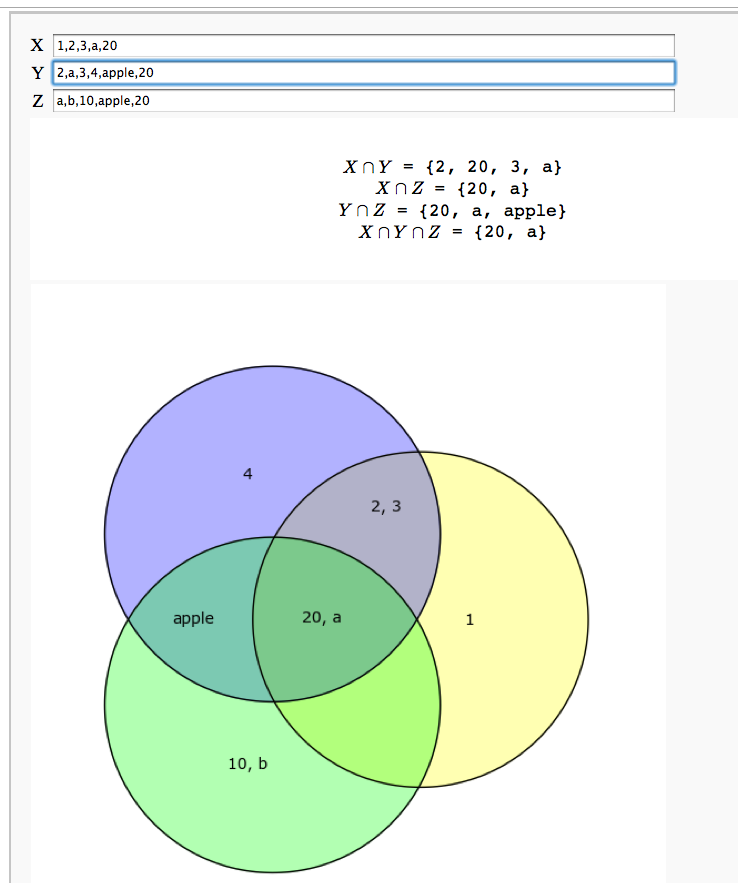
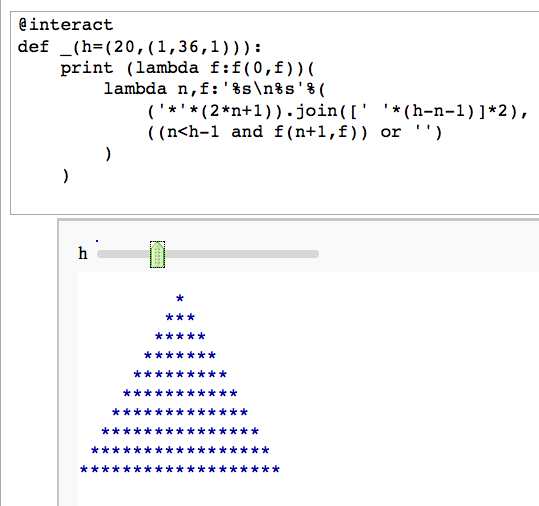
Unreadable code
by Igor Tolkov
@interact
def _(h=(20,(1,36,1))):
    print (lambda f:f(0,f))(
        lambda n,f:'%s\n%s'%(
            ('*'*(2*n+1)).join([' '*(h-n-1)]*2),
            ((n<h-1 and f(n+1,f)) or '')
        )
    )
Profile a snippet of code
html('<h2>Profile the given input</h2>')
import cProfile; import profile
@interact
def _(cmd = ("Statement", '2 + 2'),
      do_preparse=("Preparse?", True), cprof =("cProfile?", False)):
    if do_preparse: cmd = preparse(cmd)
    print "<html>"  # trick to avoid word wrap
    if cprof:
        cProfile.run(cmd)
    else:
        profile.run(cmd)
    print "</html>"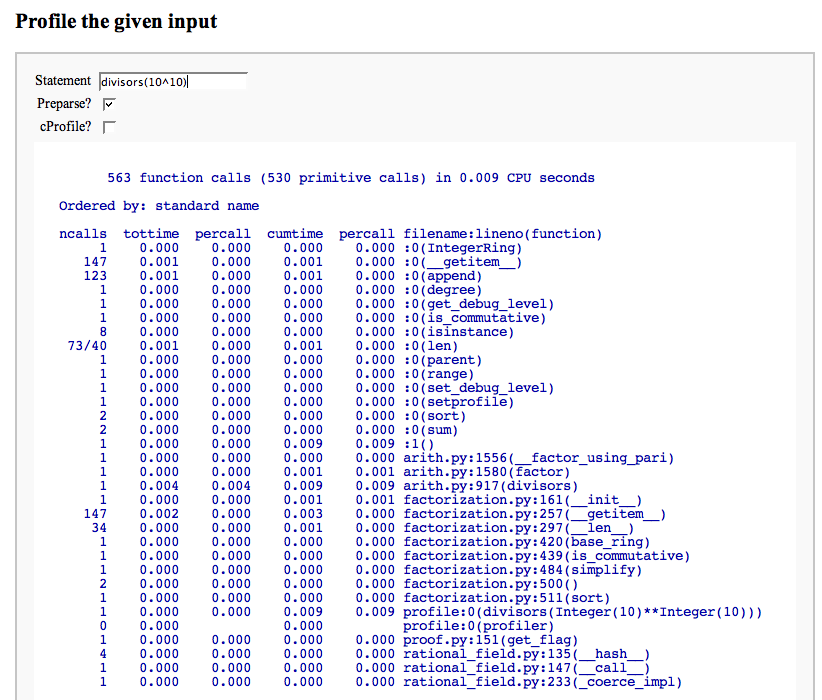
Evaluate a bit of code in a given system
by William Stein (there is no way yet to make the text box big):
@interact
def _(system=selector([('sage0', 'Sage'), ('gp', 'PARI'), ('magma', 'Magma')]), code='2+2'):
    print globals()[system].eval(code)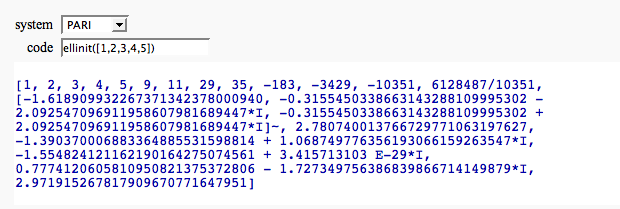
A Random Walk
by William Stein
html('<h1>A Random Walk</h1>')
vv = []; nn = 0
@interact
def foo(pts = checkbox(True, "Show points"),
        refresh = checkbox(False, "New random walk every time"),
        steps = (50,(10..500))):
    # We cache the walk in the global variable vv, so that
    # checking or unchecking the points checkbox doesn't change
    # the random walk.
    html("<h2>%s steps</h2>"%steps)
    global vv
    if refresh or len(vv) == 0:
        s = 0; v = [(0,0)]
        for i in range(steps):
             s += random() - 0.5
             v.append((i, s))
        vv = v
    elif len(vv) != steps:
        # Add or subtract some points
        s = vv[-1][1]; j = len(vv)
        for i in range(steps - len(vv)):
            s += random() - 0.5
            vv.append((i+j,s))
        v = vv[:steps]
    else:
        v = vv
    L = line(v, rgbcolor='#4a8de2')
    if pts: L += points(v, pointsize=10, rgbcolor='red')
    show(L, xmin=0, figsize=[8,3])
3D Random Walk
@interact
def rwalk3d(n=(50,1000), frame=True):
    pnt = [0,0,0]
    v = [copy(pnt)]
    for i in range(n):
        pnt[0] += random()-0.5
        pnt[1] += random()-0.5
        pnt[2] += random()-0.5
        v.append(copy(pnt))
    show(line3d(v,color='black'),aspect_ratio=[1,1,1],frame=frame)
Minkowski Sum
by Marshall Hampton
def minkdemo(list1,list2):
    '''
    Returns the Minkowski sum of two lists.
    '''
    output = []
    for stuff1 in list1:
        for stuff2 in list2:
            temp = [stuff1[i] + stuff2[i] for i in range(len(stuff1))]
            output.append(temp)
    return output
@interact
def minksumvis(x1tri = slider(-1,1,1/10,0, label = 'Triangle point x coord.'), yb = slider(1,4,1/10,2, label = 'Blue point y coord.')):
    t_list = [[1,0],[x1tri,1],[0,0]]
    kite_list = [[3, 0], [1, 0], [0, 1], [1, yb]]
    triangle = polygon([[q[0]-6,q[1]] for q in t_list], alpha = .5, rgbcolor = (1,0,0))
    t_vert = point([x1tri-6,1], rgbcolor = (1,0,0))
    b_vert = point([kite_list[3][0]-4,yb], rgbcolor = (0,0,1))
    kite = polygon([[q[0]-4,q[1]] for q in kite_list], alpha = .5,rgbcolor = (0,0,1))
    p12 = minkdemo(t_list, kite_list)
    p12 = [[q[0],q[1]] for q in p12]
    p12poly = Polyhedron(p12)
    edge_lines = Graphics()
    verts = p12poly.vertices()
    for an_edge in p12poly.vertex_adjacencies():
        edge_lines += line([verts[an_edge[0]], verts[an_edge[1][0]]])
        edge_lines += line([verts[an_edge[0]], verts[an_edge[1][1]]])
    triangle_sum = Graphics()
    for vert in kite_list:
        temp_list = []
        for q in t_list:
            temp_list.append([q[i] + vert[i] for i in range(len(t_list[0]))])
        triangle_sum += polygon(temp_list, alpha = .5, rgbcolor = (1,0,0))
    kite_sum = Graphics()
    for vert in t_list:
        temp_list = []
        for q in kite_list:
            temp_list.append([q[i] + vert[i] for i in range(len(t_list[0]))])
        kite_sum += polygon(temp_list, alpha = .3,rgbcolor = (0,0,1))
    labels = text('+', (-4.3,.5), rgbcolor = (0,0,0))
    labels += text('=', (-.2,.5), rgbcolor = (0,0,0))
    show(labels + t_vert + b_vert+ triangle + kite + triangle_sum + kite_sum + edge_lines, axes=False, figsize = [11.0*.7, 4*.7], xmin = -6, ymin = 0, ymax = 4)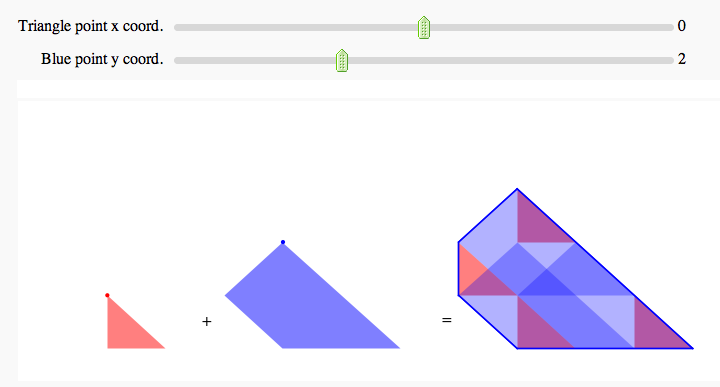
Cellular Automata
by Pablo Angulo
%cython
from numpy import zeros

def cellular(rule, int N):
    '''Yields a matrix showing the evolution of a Wolfram's cellular automaton

    rule:     determines how a cell's value is updated, depending on its neighbors
    N:        number of iterations
    '''
    cdef int j,k,l
    M=zeros( (N,2*N+1), dtype=int)
    M[0,N]=1

    for j in range(1,N):
        for k in range(N-j,N+j+1):
            l = 4*M[j-1,k-1] + 2*M[j-1,k] + M[j-1,k+1]
            M[j,k]=rule[ l ]
    return M
def num2rule(number):
if not 0 <= number <= 255:
raise Exception('Invalid rule number')
binary_digits = number.digits(base=2)
return binary_digits + [0]*(8-len(binary_digits))
@interact
def _( N=input_box(label='Number of iterations',default=100),
rule_number=input_box(label='Rule number',default=110),
size = slider(1, 11, step_size=1, default=6 ) ):
rule = num2rule(rule_number)
M = cellular(rule, N)
plot_M = matrix_plot(M)
plot_M.show( figsize=[size,size])