|
Size: 8274
Comment: small improvements to the second interact
|
Size: 10936
Comment:
|
| Deletions are marked like this. | Additions are marked like this. |
| Line 98: | Line 98: |
| def F(uu, vv): X = vector([x, y, z]) return X.subs({u : uu, v : vv}) S_plot = parametric_plot3d( F(u, v), |
F = vector([x, y, z]) S_plot = parametric_plot3d( F, |
| Line 106: | Line 104: |
| show(S_plot, aspect_ratio = [1, 1, 1]) dFu = F(u, v).diff(u) dFv = F(u, v).diff(v) |
S_plot.show(aspect_ratio = [1, 1, 1]) dFu = F.diff(u) dFv = F.diff(v) |
| Line 117: | Line 115: |
| dFtt = F(ufunc, vfunc).diff(t, t) | dFtt = F(u=ufunc, v=vfunc).diff(t, t) |
| Line 138: | Line 136: |
| Line 145: | Line 143: |
| Line 181: | Line 180: |
| t = srange(0, int_s, 0.01) ) geo3D = [F(l,r) for [j, k, l, r] in geo2D_aux] |
t = srange(0, int_s, 0.01)) geo3D = [F(u=l,v=r) for [j, k, l, r] in geo2D_aux] |
| Line 186: | Line 185: |
| g_plot = fading_line3d(geo3D, rgbcolor1 = (1, 0, 0), rgbcolor2 = (0, 1, 0), thickness=4) |
g_plot = fading_line3d(geo3D, rgbcolor1 = (1, 0, 0), rgbcolor2 = (0, 1, 0), thickness=4) |
| Line 193: | Line 189: |
| P = F(Point[0], Point[1]) | P = F(u=Point[0], v=Point[1]) |
| Line 202: | Line 198: |
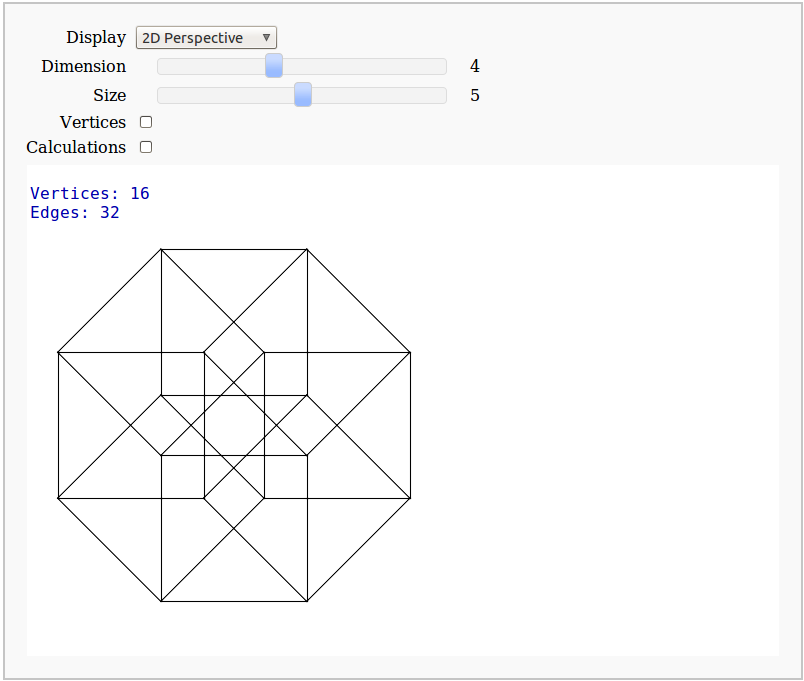
== Dimensional Explorer == Renders 2D images (perspective or spring-layout) and 3D models of 0-10 dimensional hypercubes. It also displays number of edges and vertices. {{{ @interact def render(Display=selector(['2D Perspective', '2D Spring-layout', '3D']), Dimension=slider(0,10,default=4, step_size=1), Size=slider(0,10,default=5,step_size=1), Vertices=False, Calculations=False): if Display=='2D Perspective': if Dimension==0: g=graphs.GridGraph([1]) print 'Vertices:', len(g.vertices()), ('(2^%s)'%Dimension if Calculations else ''), '\nEdges:', len(g.edges()), ('(%s*(%s/2))' %(len(g.vertices()), Dimension) if Calculations else '') g.show(figsize=[Size,Size], vertex_size=30, vertex_labels=False, transparent=True, vertex_colors='black') else: g=graphs.CubeGraph(Dimension) print 'Vertices:', len(g.vertices()), ('(2^%s)'%Dimension if Calculations else ''), '\nEdges:', len(g.edges()), ('(%s*(%s/2))' %(len(g.vertices()), Dimension) if Calculations else '') g.show(figsize=[Size,Size], vertex_size=(20 if Vertices else 0), vertex_labels=False, transparent=True, vertex_colors='black') if Display=='2D Spring-layout': if Dimension==0: s=graphs.GridGraph([1]) print 'Vertices:', len(s.vertices()), ('(2^%s)'%Dimension if Calculations else ''), '\nEdges:', len(s.edges()), ('(%s*(%s/2))' %(len(s.vertices()), Dimension) if Calculations else '') s.show(figsize=[Size,Size], vertex_size=30, vertex_labels=False, transparent=True, vertex_colors='black') else: s=graphs.GridGraph([2]*Dimension) print 'Vertices:', len(s.vertices()), ('(2^%s)'%Dimension if Calculations else ''), '\nEdges:', len(s.edges()), ('(%s*(%s/2))' %(len(s.vertices()), Dimension) if Calculations else '') s.show(figsize=[Size,Size], vertex_size=(20 if Vertices else 0), vertex_labels=False, transparent=True, vertex_colors='black') if Display=='3D': if Dimension==0: d=graphs.GridGraph([1]) print 'Vertices:', len(d.vertices()), ('(2^%s)'%Dimension if Calculations else ''), '\nEdges:', len(d.edges()), ('(%s*(%s/2))' %(len(d.vertices()), Dimension) if Calculations else '') d.show3d(figsize=[Size/2,Size/2], vertex_size=0.001) else: d=graphs.CubeGraph(Dimension) print 'Vertices:', len(d.vertices()), ('(2^%s)'%Dimension if Calculations else ''), '\nEdges:', len(d.edges()), ('(%s*(%s/2))' %(len(d.vertices()), Dimension) if Calculations else '') d.show3d(figsize=[Size,Size], vertex_size=(0.03 if Vertices else 0.001)) }}} {{attachment:dimensions.png}} |
Sage Interactions - Geometry
goto interact main page
Contents
Intersecting tetrahedral reflections
by Marshall Hampton. Inspired by a question from Hans Schepker of Glass Geometry.
#Pairs of tetrahedra, one the reflection of the other in the internal face, are joined by union operations:
p1 = Polyhedron(vertices = [[1,1,1],[1,1,0],[0,1,1],[1,0,1]])
p2 = Polyhedron(vertices = [[1/3,1/3,1/3],[1,1,0],[0,1,1],[1,0,1]])
p12 = p1.union(p2)
p3 = Polyhedron(vertices = [[0,0,1],[0,0,0],[0,1,1],[1,0,1]])
p4 = Polyhedron(vertices = [[2/3,2/3,1/3],[0,0,0],[0,1,1],[1,0,1]])
p34 = p3.union(p4)
p5 = Polyhedron(vertices = [[1,0,0],[1,0,1],[0,0,0],[1,1,0]])
p6 = Polyhedron(vertices = [[1/3,2/3,2/3],[1,0,1],[0,0,0],[1,1,0]])
p56 = p5.union(p6)
p7 = Polyhedron(vertices = [[0,1,0],[0,0,0],[1,1,0],[0,1,1]])
p8 = Polyhedron(vertices = [[2/3,1/3,2/3],[0,0,0],[1,1,0],[0,1,1]])
p78 = p7.union(p8)
pti = p12.intersection(p34).intersection(p56).intersection(p78)
@interact
def tetra_plot(opac = slider(srange(0,1.0,.25), default = .25)):
    p12r = p12.render_wireframe()+p12.render_solid(opacity = opac)
    p34r = p34.render_wireframe()+p34.render_solid(rgbcolor = (0,0,1),opacity = opac)
    p56r = p56.render_wireframe()+p56.render_solid(rgbcolor = (0,1,0),opacity = opac)
    p78r = p78.render_wireframe()+p78.render_solid(rgbcolor = (0,1,1),opacity = opac)
    ptir = pti.render_wireframe()+pti.render_solid(rgbcolor = (1,0,1),opacity = .9)
    show(p12r+p34r+p56r+p78r+ptir, frame = False)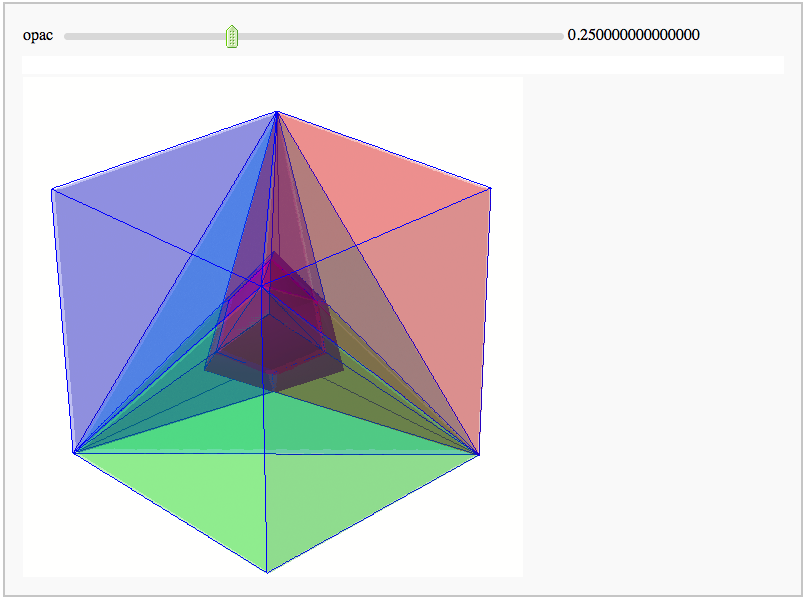
Evolutes
by Pablo Angulo. Computes the evolute of a plane curve given in parametric coordinates. The curve must be parametrized from the interval [0,2pi].
var('t');
def norma(v):
    return sqrt(sum(x^2 for x in v))
paso_angulo=5

@interact
def _( gamma1=input_box(default=sin(t)), gamma2=input_box(default=1.3*cos(t)),
    draw_normal_lines=True,
    rango_angulos=range_slider(0,360,paso_angulo,(0,90),label='Draw lines for these angles'),
    draw_osculating_circle=True,
    t0=input_box(default=pi/3,label='parameter value for the osculating circle'),
    auto_update=False ):

    gamma=(gamma1,gamma2)
    gammap=(gamma[0].derivative(),gamma[1].derivative())
    normal=(gammap[1]/norma(gammap), -gammap[0]/norma(gammap))
    gammapp=(gammap[0].derivative(),gammap[1].derivative())

    np=norma(gammap)
    npp=norma(gammapp)
    pe=gammap[0]*gammapp[0]+gammap[1]*gammapp[1]
    curvatura=(gammap[1]*gammapp[0]-gammap[0]*gammapp[1])/norma(gammap)^3
    radio=1/curvatura

    centros=(gamma[0]+radio*normal[0],gamma[1]+radio*normal[1])

    curva=parametric_plot(gamma,(t,0,2*pi))
    evoluta=parametric_plot(centros,(t,0,2*pi), color='red')
    grafica=curva+evoluta

    if draw_normal_lines:
        f=2*pi/360
        lineas=sum(line2d( [ (gamma[0](t=i*f), gamma[1](t=i*f)),
                             (centros[0](t=i*f), centros[1](t=i*f)) ],
                           thickness=1,rgbcolor=(1,0.8,0.8))
                   for i in range(rango_angulos[0], rango_angulos[1]+paso_angulo, paso_angulo))
        grafica+=lineas

    if draw_osculating_circle and 0<t0<2*pi:
        punto=point((gamma[0](t=t0), gamma[1](t=t0)), rgbcolor=hue(0),pointsize=30)
        circulo=circle( (centros[0](t=t0), centros[1](t=t0)), radio(t=t0) )
        grafica+=punto+circulo

    show(grafica,aspect_ratio=1,xmin=-2,xmax=2,ymin=-2,ymax=2)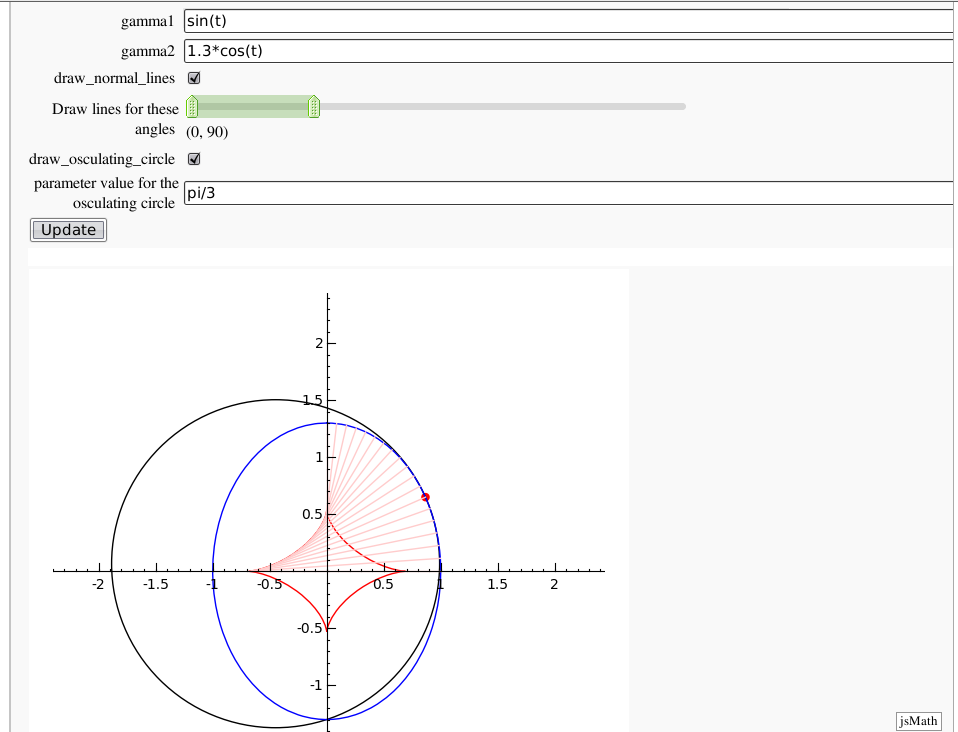
Geodesics on a parametric surface
by Antonio Valdés and Pablo Angulo. A first interact allows the user to introduce a parametric surface, and draws it. Then a second interact draws a geodesic within the surface. The separation is so that after the first interact, the geodesic equations are "compiled", and then the second interact is faster.
u, v, t = var('u v t')
@interact
def _(x = input_box(3*sin(u)*cos(v), 'x'),
      y = input_box(sin(u)*sin(v), 'y'),
      z = input_box(2*cos(u), 'z'),
      _int_u = input_grid(1, 2, default = [[0,pi]], label = 'u -interval'),
      _int_v = input_grid(1, 2, default = [[-pi,pi]], label = 'v -interval')):

    global F, Fu, Fv, func, S_plot, int_u, int_v
    int_u = _int_u[0]
    int_v = _int_v[0]

    F = vector([x, y, z])

    S_plot = parametric_plot3d( F,
                                (u, int_u[0], int_u[1]),
                                (v, int_v[0], int_v[1]))
    S_plot.show(aspect_ratio = [1, 1, 1])

    dFu = F.diff(u)
    dFv = F.diff(v)

    Fu = fast_float(dFu, u, v)
    Fv = fast_float(dFv, u, v)

    ufunc = function('ufunc', t)
    vfunc = function('vfunc', t)

    dFtt = F(u=ufunc, v=vfunc).diff(t, t)

    ec1 = dFtt.dot_product(dFu(u=ufunc, v=vfunc))
    ec2 = dFtt.dot_product(dFv(u=ufunc, v=vfunc))

    dv, ddv, du, ddu = var('dv, ddv, du, ddu')

    diffec1 = ec1.subs_expr(diff(ufunc, t) == du,
                            diff(ufunc, t, t) == ddu,
                            diff(vfunc, t) == dv,
                            diff(vfunc, t, t) == ddv,
                            ufunc == u, vfunc == v)
    diffec2 = ec2.subs_expr(diff(ufunc, t) == du,
                            diff(ufunc, t, t) == ddu,
                            diff(vfunc, t) == dv,
                            diff(vfunc, t, t) == ddv,
                            ufunc == u, vfunc == v)
    sols = solve([diffec1 == 0 , diffec2 == 0], ddu, ddv)

    ddu_rhs = (sols[0][0]).rhs().full_simplify()
    ddv_rhs = (sols[0][1]).rhs().full_simplify()

    ddu_ff = fast_float(ddu_rhs, du, dv, u, v)
    ddv_ff = fast_float(ddv_rhs, du, dv, u, v)

    def func(y,t):
        v = list(y)
        return [ddu_ff(*v), ddv_ff(*v), v[0], v[1]]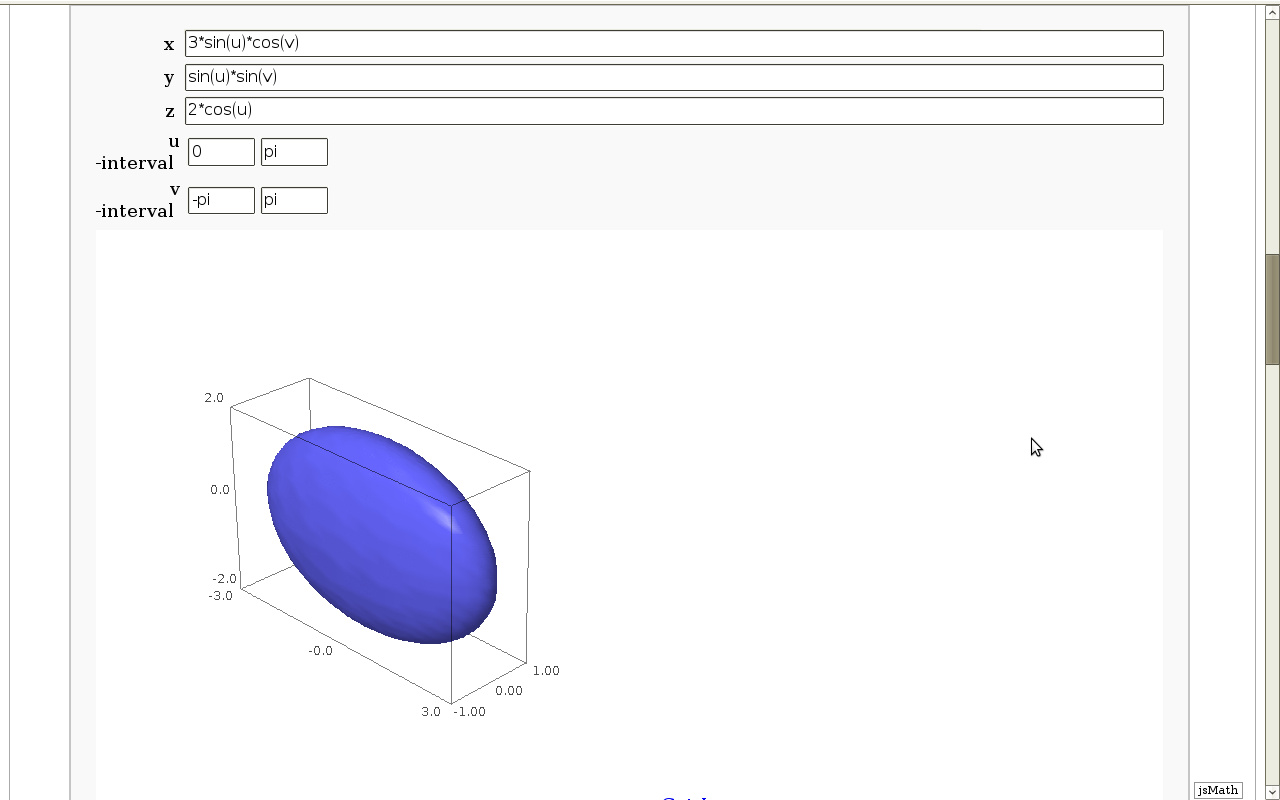
from scipy.integrate import odeint

def fading_line3d(points, rgbcolor1, rgbcolor2, *args, **kwds):
    L = len(points)
    vcolor1 = vector(RDF, rgbcolor1)
    vcolor2 = vector(RDF, rgbcolor2)
    return sum(line3d(points[j:j+2],
                      rgbcolor = tuple( ((L-j)/L)*vcolor1 + (j/L)*vcolor2 ),
                      *args, **kwds)
               for j in srange(L-1))

steps = 100

@interact
def _(u_0 = slider(int_u[0], int_u[1], (int_u[1] - int_u[0])/100,
                   default = (int_u[0] + int_u[1])/2, label = 'u_0'),
      v_0 = slider(int_v[0], int_v[1], (int_v[1] - int_v[0])/100,
                   default = (int_v[0] + int_v[1])/2, label = 'v_0'),
      V_u = slider(-10, 10, 1/10, default = 1, label = 'V_u'),
      V_v = slider(-10, 10, 1/10, default = 0, label = 'V_v'),
      int_s = slider(0, 10, 1/10,
                           default = (int_u[1] - int_u[0])/2,
                           label = 'geodesic interval'),
      sliding_color = checkbox(True,'change color along the geodesic')):

        du, dv, u, v = var('du dv u v')
        Point = [u_0, v_0]
        velocity = [V_u, V_v]
        Point = map(float, Point)
        velocity = map(float, velocity)

        geo2D_aux = odeint(func,
                           y0 = [velocity[0], velocity[1], Point[0], Point[1]],
                           t = srange(0, int_s, 0.01))

        geo3D = [F(u=l,v=r) for [j, k, l, r] in geo2D_aux]

        if sliding_color:
            g_plot = fading_line3d(geo3D, rgbcolor1 = (1, 0, 0), rgbcolor2 = (0, 1, 0), thickness=4)
        else:
            g_plot = line3d(geo3D, rgbcolor=(0, 1, 0), thickness=4)

        P = F(u=Point[0], v=Point[1])
        P_plot = point3d((P[0], P[1], P[2]), rgbcolor = (0, 0, 0), pointsize = 30)
        V = velocity[0] * Fu(u = Point[0], v = Point[1]) + \
            velocity[1] * Fv(u= Point[0], v = Point[1])
        V_plot = arrow3d(P, P + V, color = 'black')

        show(g_plot + S_plot + V_plot + P_plot,aspect_ratio = [1, 1, 1])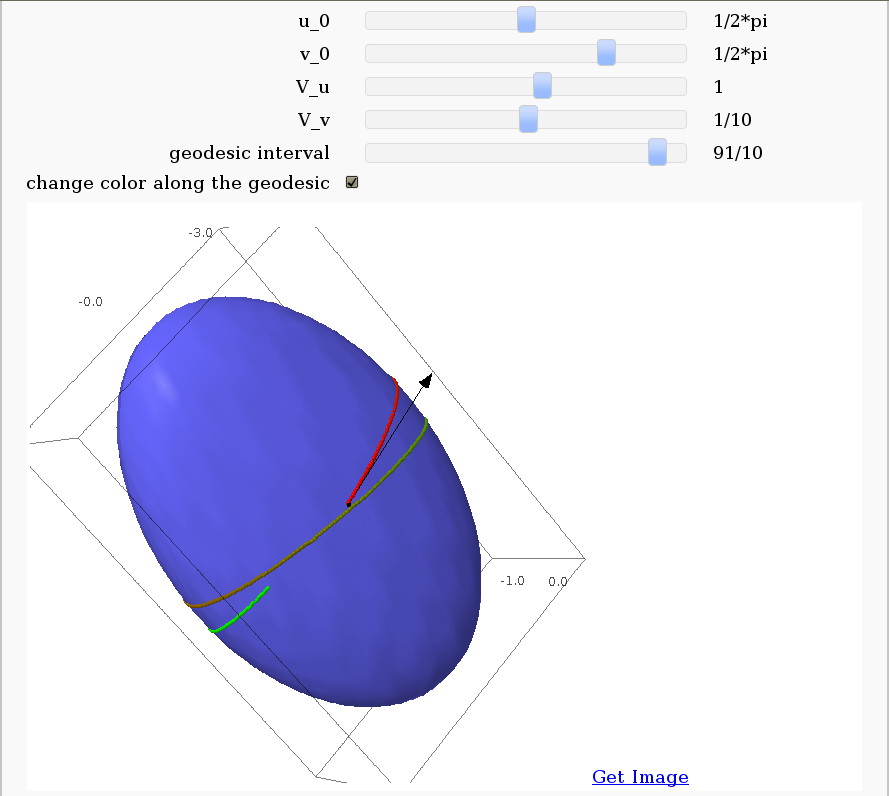
Dimensional Explorer
Renders 2D images (perspective or spring-layout) and 3D models of 0-10 dimensional hypercubes. It also displays number of edges and vertices.
@interact
def render(Display=selector(['2D Perspective', '2D Spring-layout', '3D']), Dimension=slider(0,10,default=4, step_size=1), Size=slider(0,10,default=5,step_size=1), Vertices=False, Calculations=False):

    if Display=='2D Perspective':

        if Dimension==0:
            g=graphs.GridGraph([1])
            print 'Vertices:', len(g.vertices()), ('(2^%s)'%Dimension if Calculations else ''), '\nEdges:', len(g.edges()), ('(%s*(%s/2))' %(len(g.vertices()), Dimension) if Calculations else '')
            g.show(figsize=[Size,Size], vertex_size=30, vertex_labels=False, transparent=True, vertex_colors='black')

        else:
            g=graphs.CubeGraph(Dimension)
            print 'Vertices:', len(g.vertices()), ('(2^%s)'%Dimension if Calculations else ''), '\nEdges:', len(g.edges()), ('(%s*(%s/2))' %(len(g.vertices()), Dimension) if Calculations else '')
            g.show(figsize=[Size,Size], vertex_size=(20 if Vertices else 0), vertex_labels=False, transparent=True, vertex_colors='black')

    if Display=='2D Spring-layout':

        if Dimension==0:
            s=graphs.GridGraph([1])
            print 'Vertices:', len(s.vertices()), ('(2^%s)'%Dimension if Calculations else ''), '\nEdges:', len(s.edges()), ('(%s*(%s/2))' %(len(s.vertices()), Dimension) if Calculations else '')
            s.show(figsize=[Size,Size], vertex_size=30, vertex_labels=False, transparent=True, vertex_colors='black')

        else:
            s=graphs.GridGraph([2]*Dimension)
            print 'Vertices:', len(s.vertices()), ('(2^%s)'%Dimension if Calculations else ''), '\nEdges:', len(s.edges()), ('(%s*(%s/2))' %(len(s.vertices()), Dimension) if Calculations else '')
            s.show(figsize=[Size,Size], vertex_size=(20 if Vertices else 0), vertex_labels=False, transparent=True, vertex_colors='black')

    if Display=='3D':
        if Dimension==0:
            d=graphs.GridGraph([1])
            print 'Vertices:', len(d.vertices()), ('(2^%s)'%Dimension if Calculations else ''), '\nEdges:', len(d.edges()), ('(%s*(%s/2))' %(len(d.vertices()), Dimension) if Calculations else '')
            d.show3d(figsize=[Size/2,Size/2], vertex_size=0.001)

        else:
            d=graphs.CubeGraph(Dimension)
            print 'Vertices:', len(d.vertices()), ('(2^%s)'%Dimension if Calculations else ''), '\nEdges:', len(d.edges()), ('(%s*(%s/2))' %(len(d.vertices()), Dimension) if Calculations else '')
            d.show3d(figsize=[Size,Size], vertex_size=(0.03 if Vertices else 0.001))