|
Size: 13859
Comment:
|
Size: 15336
Comment:
|
| Deletions are marked like this. | Additions are marked like this. |
| Line 210: | Line 210: |
| == Picard iteration example == by Marshall Hampton and David Joyner {{{ def picard_iteration(f, a, c, iterations): ''' Computes the N-th Picard iterate for the IVP x' = f(t,x), x(a) = c. EXAMPLES: sage: var('x t s') (x, t, s) sage: a = 0; c = 2 sage: f = lambda t,x: 1-x sage: picard_iteration(f, a, c, 0) 2 sage: picard_iteration(f, a, c, 1) 2 - t sage: picard_iteration(f, a, c, 2) t^2/2 - t + 2 sage: picard_iteration(f, a, c, 3) -t^3/6 + t^2/2 - t + 2 ''' if iterations == 0: return c if iterations == 1: x0 = lambda t: c + integral(f(t=s,x=c), s, a, t) return expand(x0(t)) for i in range(iterations): x_old = lambda s: picard_iteration(f, a, c, iterations-1).subs(t=s) x0 = lambda t: c + integral(f(t=s,x=x_old(s)), s, a, t) return expand(x0(t)) @interact def picarder(n_iterations = slider(0,20,1,default = 2)): var('x,t,s') f = lambda t,x:x html("Exact solution to $x' = x$, $x(0) = 1$ is $x = \exp(t)$<br>") pic = picard_iteration(f,0,1,n_iterations) html('The Picard iteration approximatio after ' + str(n_iterations) + ' iterations is:<br>') html('$'+latex(pic)+'$') exact = plot(exp(t),(t,0,2)) pic_plot = plot(pic,(t,0,2), rgbcolor = (1,0,0)) show(exact + pic_plot) }}} {{attachment:picard.png}} |
Sage Interactions - Differential Equations
goto interact main page
Contents
-
Sage Interactions - Differential Equations
- Euler's Method in one variable
- Vector Fields and Euler's Method
- Vector Field with Runga-Kutta-Fehlberg
- Euler's Method, Improved Euler, and 4th order Runge-Kutta in one variable
- Mass/Spring systems
- Picard iteration example
- Autonomous equations and stable/unstable fixed points
- Heat equation using Fourier series
- Heat equation using finite diferences in cython (very fast!)
- DE with boundary values
Euler's Method in one variable
by Marshall Hampton. This needs some polishing but its usable as is.
def tab_list(y, headers = None):
    '''
    Converts a list into an html table with borders.
    '''
    s = '<table border = 1>'
    if headers:
        for q in headers:
            s = s + '<th>' + str(q) + '</th>'
    for x in y:
        s = s + '<tr>'
        for q in x:
            s = s + '<td>' + str(q) + '</td>'
        s = s + '</tr>'
    s = s + '</table>'
    return s
var('x y')
@interact
def euler_method(y_exact_in = input_box('-cos(x)+1.0', type = str, label = 'Exact solution = '), y_prime_in = input_box('sin(x)', type = str, label = "y' = "), start = input_box(0.0, label = 'x starting value: '), stop = input_box(6.0, label = 'x stopping value: '), startval = input_box(0.0, label = 'y starting value: '), nsteps = slider([2^m for m in range(0,10)], default = 10, label = 'Number of steps: '), show_steps = slider([2^m for m in range(0,10)], default = 8, label = 'Number of steps shown in table: ')):
    y_exact = lambda x: eval(y_exact_in)
    y_prime = lambda x,y: eval(y_prime_in)
    stepsize = float((stop-start)/nsteps)
    steps_shown = max(nsteps,show_steps)
    sol = [startval]
    xvals = [start]
    for step in range(nsteps):
        sol.append(sol[-1] + stepsize*y_prime(xvals[-1],sol[-1]))
        xvals.append(xvals[-1] + stepsize)
    sol_max = max(sol + [find_maximum_on_interval(y_exact,start,stop)[0]])
    sol_min = min(sol + [find_minimum_on_interval(y_exact,start,stop)[0]])
    show(plot(y_exact(x),start,stop,rgbcolor=(1,0,0))+line([[xvals[index],sol[index]] for index in range(len(sol))]),xmin=start,xmax = stop, ymax = sol_max, ymin = sol_min)
    if nsteps < steps_shown:
        table_range = range(len(sol))
    else:
        table_range = range(0,floor(steps_shown/2)) + range(len(sol)-floor(steps_shown/2),len(sol))
    html(tab_list([[i,xvals[i],sol[i]] for i in table_range], headers = ['step','x','y']))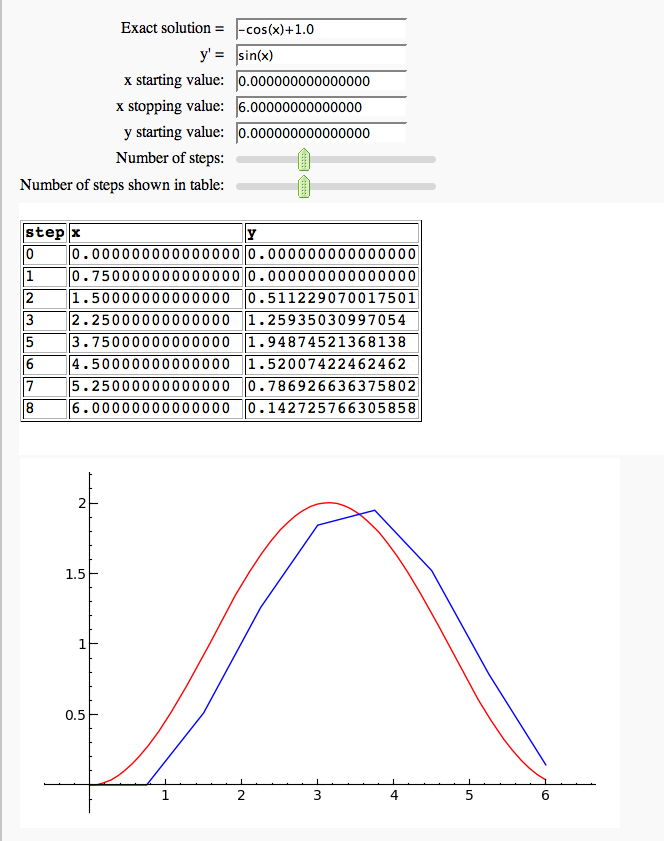
Vector Fields and Euler's Method
by Mike Hansen (tested and updated by William Stein, and later by Dan Drake)
x,y = var('x,y')
from sage.ext.fast_eval import fast_float
@interact
def _(f = input_box(default=y), g=input_box(default=-x*y+x^3-x),
      xmin=input_box(default=-1), xmax=input_box(default=1),
      ymin=input_box(default=-1), ymax=input_box(default=1),
      start_x=input_box(default=0.5), start_y=input_box(default=0.5),
      step_size=(0.01,(0.001, 0.2)), steps=(600,(0, 1400)) ):
    ff = fast_float(f, 'x', 'y')
    gg = fast_float(g, 'x', 'y')
    steps = int(steps)

    points = [ (start_x, start_y) ]
    for i in range(steps):
        xx, yy = points[-1]
        try:
            points.append( (xx + step_size * ff(xx,yy), yy + step_size * gg(xx,yy)) )
        except (ValueError, ArithmeticError, TypeError):
            break

    starting_point = point(points[0], pointsize=50)
    solution = line(points)
    vector_field = plot_vector_field( (f,g), (x,xmin,xmax), (y,ymin,ymax) )

    result = vector_field + starting_point + solution

    html(r"$\displaystyle\frac{dx}{dt} = %s$  $ \displaystyle\frac{dy}{dt} = %s$" % (latex(f),latex(g)))
    result.show(xmin=xmin,xmax=xmax,ymin=ymin,ymax=ymax)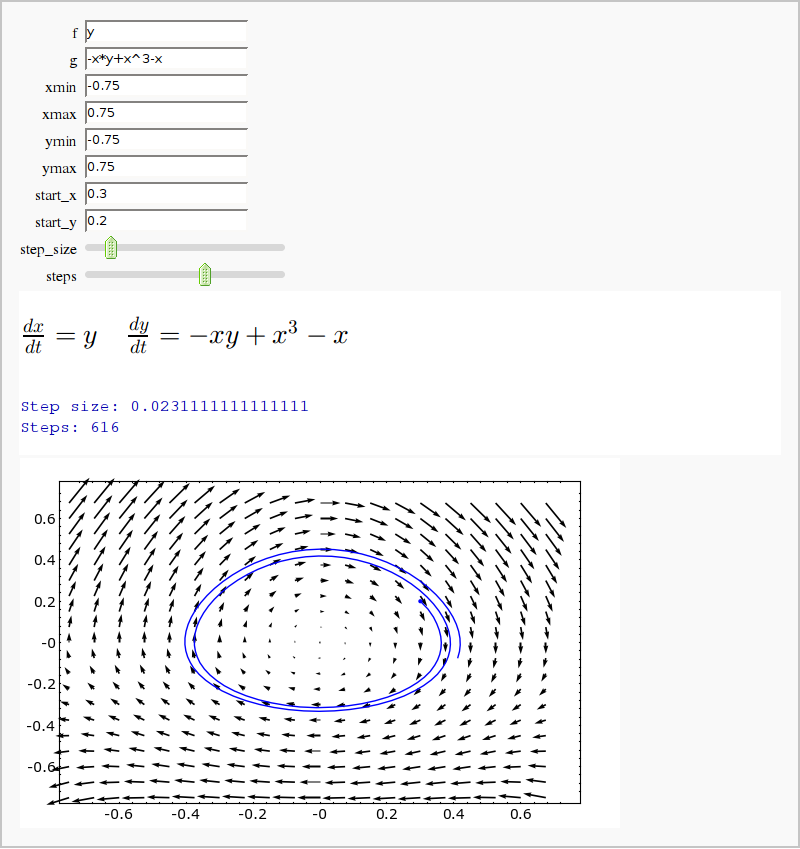
Vector Field with Runga-Kutta-Fehlberg
by Harald Schilly
# Solve ODEs using sophisticated Methods like Runga-Kutta-Fehlberg
# by Harald Schilly, April 2008
# (jacobian doesn't work, please fix ...)
var('x y')
@interact
def _(fin = input_box(default=y+exp(x/10)-1/3*((x-1/2)^2+y^3)*x-x*y^3), gin=input_box(default=x^3-x+1/100*exp(y*x^2+x*y^2)-0.7*x),
      xmin=input_box(default=-1), xmax=input_box(default=1.8),
      ymin=input_box(default=-1.3), ymax=input_box(default=1.5),
      x_start=(-1,(-2,2)), y_start=(0,(-2,2)), error=(0.5,(0,1)),
      t_length=(23,(0, 100)) , num_of_points = (1500,(5,2000)),
      algorithm = selector([
         ("rkf45" , "runga-kutta-felhberg (4,5)"),
         ("rk2" , "embedded runga-kutta (2,3)"),
         ("rk4" , "4th order classical runga-kutta"),
         ("rk8pd" , 'runga-kutta prince-dormand (8,9)'),
         ("rk2imp" , "implicit 2nd order runga-kutta at gaussian points"),
         ("rk4imp" , "implicit 4th order runga-kutta at gaussian points"),
         ("bsimp" , "implicit burlisch-stoer (requires jacobian)"),
         ("gear1" , "M=1 implicit gear"),
         ("gear2" , "M=2 implicit gear")
      ])):
    f(x,y)=fin
    g(x,y)=gin

    ff = f._fast_float_(*f.args())
    gg = g._fast_float_(*g.args())

    #solve
    path = []
    err = error
    xerr = 0
    for yerr in [-err, 0, +err]:
      T=ode_solver()
      T.algorithm=algorithm
      T.function = lambda t, yp: [ff(yp[0],yp[1]), gg(yp[0],yp[1])]
      T.jacobian = lambda t, yp: [[diff(fun,dval)(yp[0],yp[1]) for dval in [x,y]] for fun in [f,g]]
      T.ode_solve(y_0=[x_start + xerr, y_start + yerr],t_span=[0,t_length],num_points=num_of_points)
      path.append(line([p[1] for p in T.solution]))

    #plot
    vector_field = plot_vector_field( (f,g), (x,xmin,xmax), (y,ymin,ymax) )
    starting_point = point([x_start, y_start], pointsize=50)
    show(vector_field + starting_point + sum(path), aspect_ratio=1, figsize=[8,9])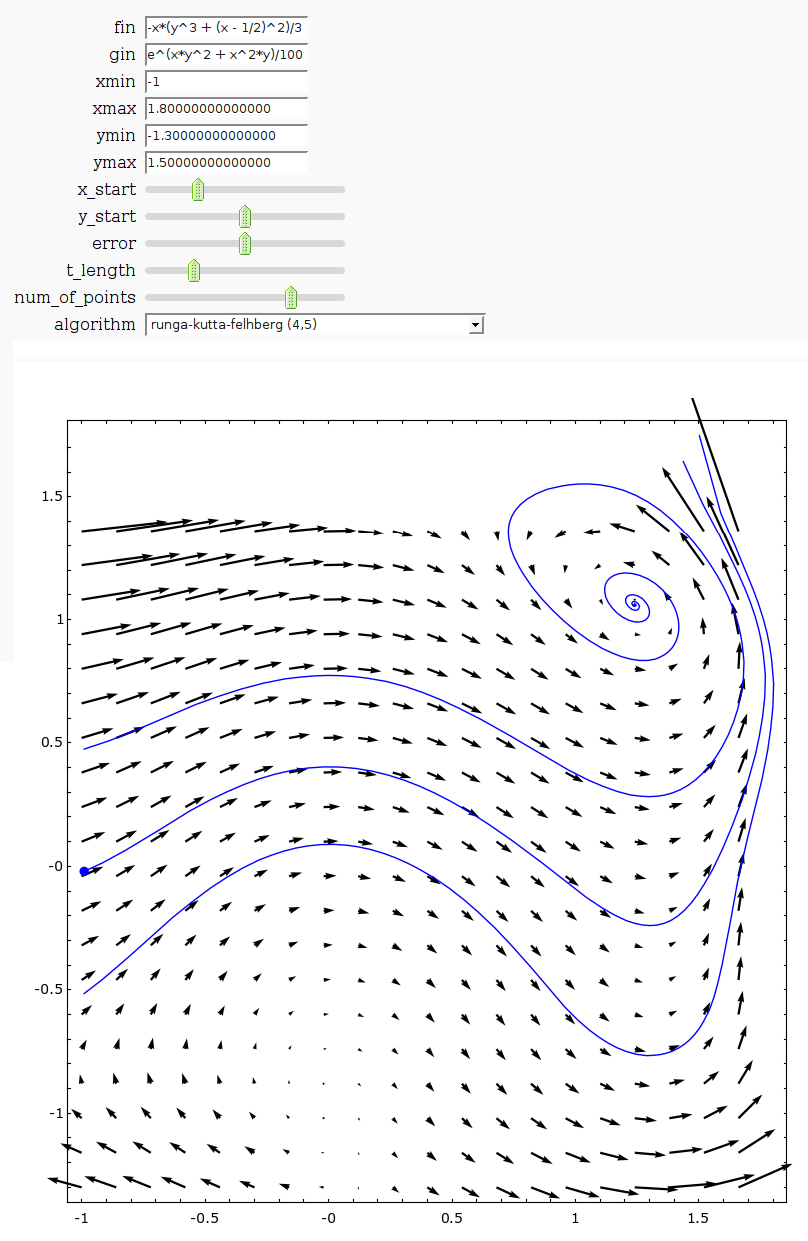
Euler's Method, Improved Euler, and 4th order Runge-Kutta in one variable
by Marshall Hampton. This is a more baroque version of the Euler's method demo above.
def ImpEulerMethod(xstart, ystart, xfinish, nsteps, f):
    sol = [ystart]
    xvals = [xstart]
    h = N((xfinish-xstart)/nsteps)
    for step in range(nsteps):
        k1 = f(xvals[-1],sol[-1])
        k2 = f(xvals[-1] + h,sol[-1] + k1*h)
        sol.append(sol[-1] + h*(k1+k2)/2)
        xvals.append(xvals[-1] + h)
    return zip(xvals,sol)
def RK4Method(xstart, ystart, xfinish, nsteps, f):
    sol = [ystart]
    xvals = [xstart]
    h = N((xfinish-xstart)/nsteps)
    for step in range(nsteps):
        k1 = f(xvals[-1],sol[-1])
        k2 = f(xvals[-1] + h/2,sol[-1] + k1*h/2)
        k3 = f(xvals[-1] + h/2,sol[-1] + k2*h/2)
        k4 = f(xvals[-1] + h,sol[-1] + k3*h)
        sol.append(sol[-1] + h*(k1+2*k2+2*k3+k4)/6)
        xvals.append(xvals[-1] + h)
    return zip(xvals,sol)
def tab_list(y, headers = None):
    '''
    Converts a list into an html table with borders.
    '''
    s = '<table border = 1>'
    if headers:
        for q in headers:
            s = s + '<th>' + str(q) + '</th>'
    for x in y:
        s = s + '<tr>'
        for q in x:
            s = s + '<td>' + str(q) + '</td>'
        s = s + '</tr>'
    s = s + '</table>'
    return s
var('x, y')
@interact
def euler_method(q = range_slider(0,10,.1,(0,6),'x range'), y_exact_in = input_box('-cos(x)+2.0', type = str, label = 'Exact solution = '), y_prime_in = input_box('sin(x)', type = str, label = "y' = "), startval = input_box(1.0, label = 'Starting value for y: '), nsteps = slider([2^m for m in range(0,10)], default = 10, label = 'Number of steps: '), show_steps = slider([2^m for m in range(0,10)], default = 8, label = 'Number of steps shown in table: ')):
    start = q[0]
    stop = q[1]
    y_exact = lambda x: eval(y_exact_in)
    y_prime = lambda x,y: eval(y_prime_in)
    stepsize = float((stop-start)/nsteps)
    steps_shown = min(nsteps,show_steps)
    sol2 = ImpEulerMethod(start, startval, stop, nsteps, y_prime)
    sol3 = RK4Method(start, startval, stop, nsteps, y_prime)
    sol = [startval]
    xvals = [start]
    for step in range(nsteps):
        sol.append(sol[-1] + stepsize*y_prime(xvals[-1],sol[-1]))
        xvals.append(xvals[-1] + stepsize)
    sol_max = max(sol + [find_maximum_on_interval(y_exact,start,stop)[0]])
    sol_min = min(sol + [find_minimum_on_interval(y_exact,start,stop)[0]])
    slopes = plot_slope_field(y_prime(x=x,y=y), (start,stop), (sol_min, sol_max))
    exact_plot = plot(y_exact(x),start,stop,rgbcolor=(1,0,0))
    euler_plot = line([[xvals[index],sol[index]] for index in range(len(sol))])
    rk4_plot = line(sol3, rgbcolor = (0,0,.125))
    imp_plot = line(sol2, rgbcolor = (1,0,1))
    show(slopes +exact_plot + euler_plot + imp_plot+ rk4_plot,xmin=start,xmax = stop, ymax = sol_max, ymin = sol_min)
    if nsteps < steps_shown:
        table_range = range(len(sol))
    else:
        table_range = range(0,floor(steps_shown/2)) + range(len(sol)-floor(steps_shown/2),len(sol))
    html(tab_list([[i,xvals[i],sol[i],sol2[i][1],sol3[i][1],y_exact(xvals[i])] for i in table_range], headers = ['step','x','<font color="#0000FF">Euler</font>','<font color="#FF00FF">Imp. Euler</font>', '<font color="#0000bb">RK4</font>','<font color="#FF0000">Exact</font>']))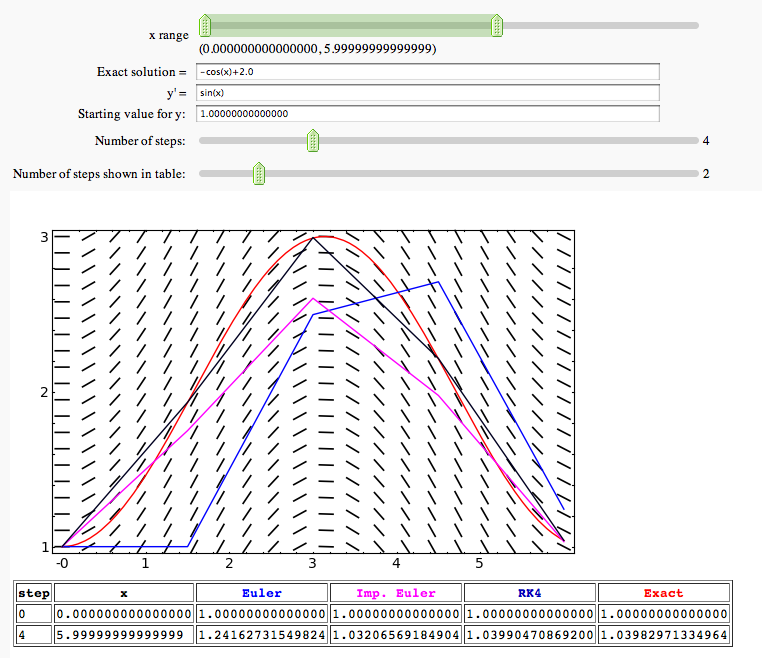
Mass/Spring systems
by Jason Grout
These two interacts involve some Cython code or other scipy imports, so I've posted a file containing them. You can download the worksheet or copy it online.
Picard iteration example
by Marshall Hampton and David Joyner
def picard_iteration(f, a, c, iterations):
    '''
    Computes the N-th Picard iterate for the IVP

        x' = f(t,x), x(a) = c.

    EXAMPLES:
        sage: var('x t s')
        (x, t, s)
        sage: a = 0; c = 2
        sage: f = lambda t,x: 1-x
        sage: picard_iteration(f, a, c, 0)
        2
         sage: picard_iteration(f, a, c, 1)
        2 - t
        sage: picard_iteration(f, a, c, 2)
        t^2/2 - t + 2
        sage: picard_iteration(f, a, c, 3)
        -t^3/6 + t^2/2 - t + 2

    '''
    if iterations == 0:
        return c
    if iterations == 1:
        x0 = lambda t: c + integral(f(t=s,x=c), s, a, t)
        return expand(x0(t))
    for i in range(iterations):
        x_old = lambda s: picard_iteration(f, a, c, iterations-1).subs(t=s)
        x0 = lambda t: c + integral(f(t=s,x=x_old(s)), s, a, t)
    return expand(x0(t))

@interact
def picarder(n_iterations = slider(0,20,1,default = 2)):
    var('x,t,s')
    f = lambda t,x:x
    html("Exact solution to $x' = x$, $x(0) = 1$ is $x = \exp(t)$<br>")
    pic = picard_iteration(f,0,1,n_iterations)
    html('The Picard iteration approximatio after ' + str(n_iterations) + ' iterations is:<br>')
    html('$'+latex(pic)+'$')
    exact = plot(exp(t),(t,0,2))
    pic_plot = plot(pic,(t,0,2), rgbcolor = (1,0,0))
    show(exact + pic_plot)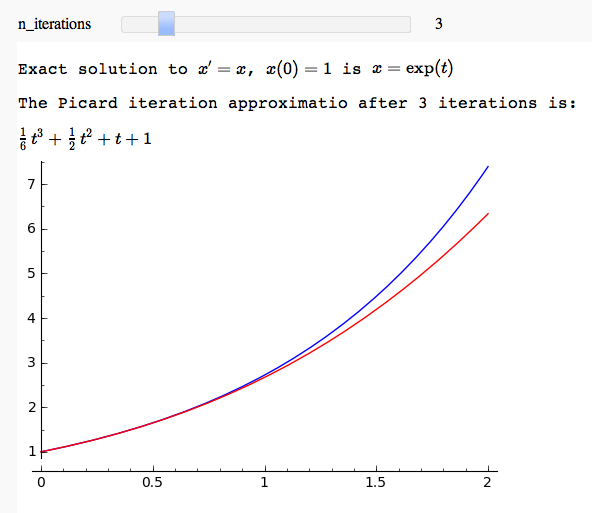
Autonomous equations and stable/unstable fixed points
by Marshall Hampton This needs the Cython functon defined in a seperate cell. Note that it is not a particularly good example of Cython use.
%cython
cpdef RK4_1d(f, double t_start, double y_start, double t_end, int steps, double y_upper = 10**6, double y_lower = -10**6):
    '''
    Fourth-order scalar Runge-Kutta solver with fixed time steps. f must be a function of t,y,
    where y is just a scalar variable.
    '''
    cdef double step_size = (t_end - t_start)/steps
    cdef double t_current = t_start
    cdef double y_current = y_start
    cdef list answer_table = []
    cdef int j
    answer_table.append([t_current,y_current])
    for j in range(0,steps):
        k1=f(t_current, y_current)
        k2=f(t_current+step_size/2, y_current + k1*step_size/2)
        k3=f(t_current+step_size/2, y_current + k2*step_size/2)
        k4=f(t_current+step_size, y_current + k3*step_size)
        t_current += step_size
        y_current = y_current + (step_size/6)*(k1+2*k2+2*k3+k4)
        if y_current > y_upper or y_current < y_lower:
            j = steps
        answer_table.append([t_current,y_current])
    return answer_table
from sage.rings.polynomial.real_roots import *
var('x')
@interact
def autonomous_plot(poly=input_box(x*(x-1)*(x-2),label='polynomial'), t_end = slider(1,10,step_size = .1)):
var('x')
y = polygen(ZZ)
ypoly = sage_eval(repr(poly).replace('x','y'),locals=locals())
rr = real_roots(ypoly, max_diameter = 1/100)
eps = 0.2
delvals = .04
minr = min([x[0][0] for x in rr])
maxr = max([x[0][1] for x in rr])
svals = [(minr-eps)*t+(1-t)*(maxr+eps) for t in srange(0,1+delvals,delvals)]
def polyf(t,xi):
return poly(x=xi)
paths = [RK4_1d(polyf,0.0,q,t_end,100.0) for q in svals]
miny = max(minr-eps,min([min([q1[1] for q1 in q]) for q in paths]))
maxy = min(maxr+eps,max([max([q1[1] for q1 in q]) for q in paths]))
solpaths = sum([line(q) for q in paths])
fixedpoints = sum([line([[0,(q[0][0]+q[0][1])/2],[t_end,(q[0][0]+q[0][1])/2]], rgbcolor = (1,0,0)) for q in rr])
var('t')
html("Autonomous differential equation $x' = p(x)$")
show(solpaths+fixedpoints, ymin = miny, ymax = maxy, xmin = 0, xmax = t_end, figsize = [6,4])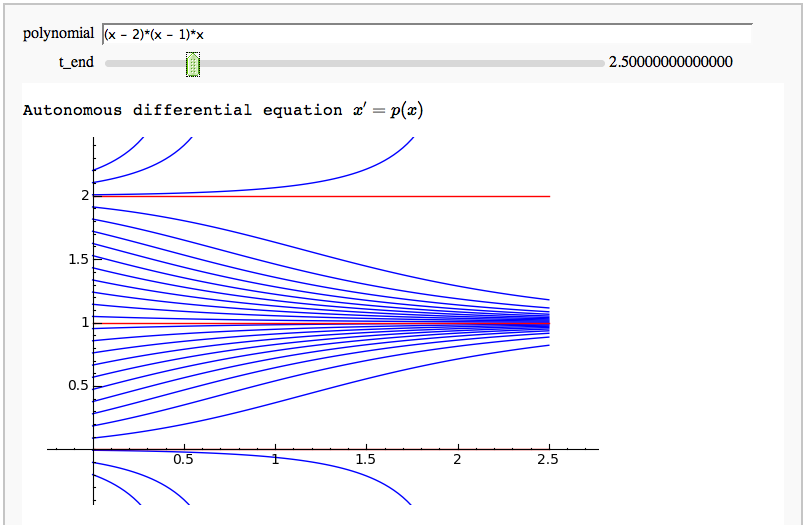
Heat equation using Fourier series
by Pablo Angulo
var('x')
x0  = 0
k=1
f   = x*exp(-x^2)
p   = plot(f,0,2*pi, thickness=2)
c   = 1/pi
orden=10
alpha=[(n,c*numerical_integral(f(x)*sin(x*n/2),0,2*pi)[0] ) for n in range(1,orden)]

@interact
def _(tiempo = (0.1*j for j in (0..10)) ):
    ft = sum( a*sin(x*n/2)*exp(-k*(n/2)^2*tiempo) for n,a in alpha)
    pt = plot(ft, 0, 2*pi, color='green', thickness=2)
    show( p + pt, ymin = -.2)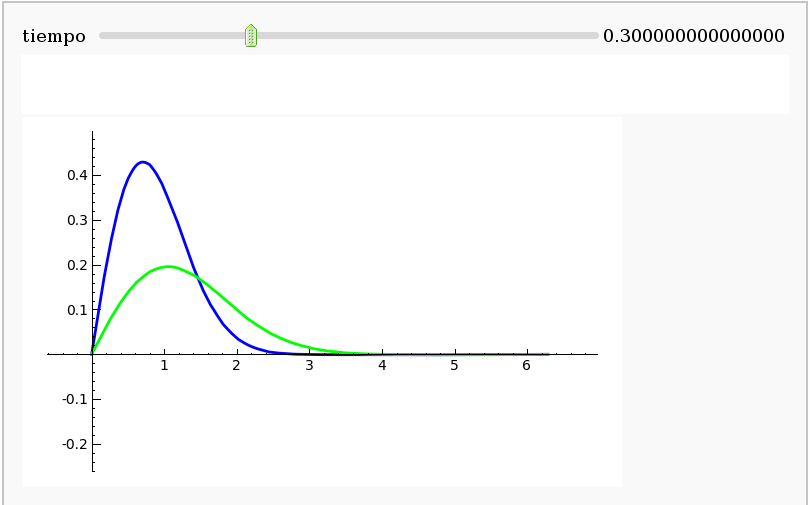
Heat equation using finite diferences in cython (very fast!)
by Pablo Angulo
%cython
#cython code implementing a very simple finite diference scheme
import numpy as np
def calor_cython(u0,float dx, float k,float t_f,int tsteps):
    cdef int m
    cdef float dt
    cdef float s
    u=np.array(u0)
    dt=t_f/tsteps
    s=k*dt/(dx**2)        #we cannot use ^ for exponentiation in cython
    for m in range(tsteps):
        u[1:-1]=(1-2*s)*u[1:-1]+s*u[0:-2]+s*u[2:]
    return u
#interact box wrapping the code above
var('x')
@interact
def _(f=input_box(default=x*exp(-x^2)), longitud=input_box(default=2*pi),
tiempo=input_box(default=0.1), M=input_box(default=100),
k=input_box(default=1), tsteps=input_box(default=2000) ):
efe=f._fast_float_()
dx=float(longitud/M)
xs=[n*dx for n in range(M+1)]
u0=[efe(a) for a in xs]
s=k*(tiempo/tsteps) /dx^2
if s>0.5:
print 's=%f > 1/2!!! The method is not stable'%s
ut=calor_cython(u0,dx,k,tiempo,tsteps)
show( line2d(zip(xs, u0)) + line2d(zip(xs, ut), rgbcolor='green') )
DE with boundary values
The following interact demo looks at the DE+BC y'+y=0, y(0)=a, y(b)=c, and has a slider for b. When b=pi "problems arise":-)
var('x')
@interact
def BCs(b=input_box(1,label='BC at far endpoint'), c = slider(1,5,step_size = .01), a = 1):
    P1 = text("$y''+y=0,\ y(0) = a,\ y(b) = c$",(4,-1/(c-3.14152)))
    P2 = plot(a*cos(x)+(b-a*cos(c))*sin(x)/sin(c),x,0,5)
    (P1+P2).show()