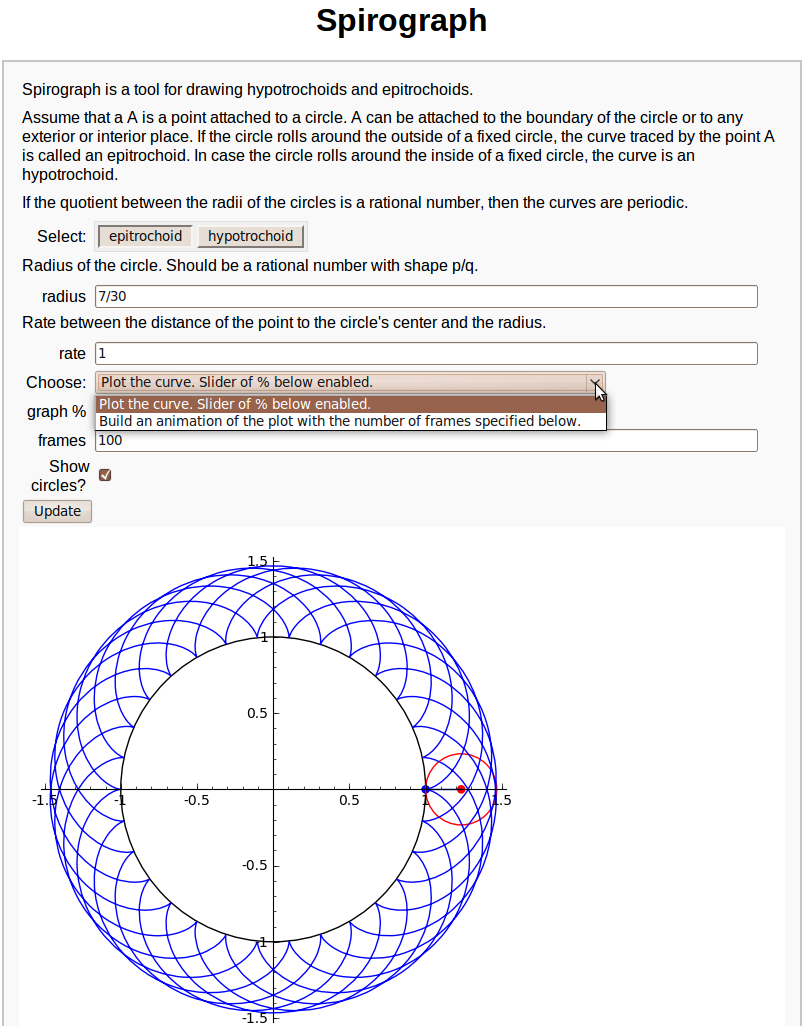
|
Size: 14158
Comment: Put import of cos, sin inside function to avoid side effects
|
Size: 14180
Comment: py3 print
|
| Deletions are marked like this. | Additions are marked like this. |
| Line 107: | Line 107: |
| print "Bug selecting plot?" | print("Bug selecting plot?") |
| Line 182: | Line 182: |
| print "There's a problem with your expression." | print("There's a problem with your expression.") |
| Line 190: | Line 190: |
| print '<html><p style="font-family:Arial, sans-serif;color:#000"><span style="color:red;font-weight:bold">Error</span>: %s</p></html>' % msg | print('<html><p style="font-family:Arial, sans-serif;color:#000"><span style="color:red;font-weight:bold">Error</span>: %s</p></html>' % msg) |
| Line 198: | Line 198: |
| print error_msg('This is not an expression.') | print(error_msg('This is not an expression.')) |
| Line 203: | Line 203: |
| print "var('%s')\nplot(%s).show(%s%s%s)" % (expression.variables()[0], repr(expression), 'aspect_ratio=1' if square else '', ', ' if square and not axes else '', 'axes=False' if not axes else '') | print("var('%s')\nplot(%s).show(%s%s%s)" % (expression.variables()[0], repr(expression), 'aspect_ratio=1' if square else '', ', ' if square and not axes else '', 'axes=False' if not axes else '')) |
| Line 209: | Line 209: |
| print "var('%s')\nplot(%s)" % (expression.variables()[0], repr(expression)) | print("var('%s')\nplot(%s)" % (expression.variables()[0], repr(expression))) |
| Line 212: | Line 212: |
| print error_msg('This expression has more than one variable.') | print(error_msg('This expression has more than one variable.')) |
| Line 215: | Line 215: |
| print error_msg("This expression contains an unknown function.") | print(error_msg("This expression contains an unknown function.")) |
| Line 273: | Line 273: |
| if h=='hypotrochoid' and (b>=1 or b<=0): print "In a hypotrochoid, radius must be between 0 and 1." draw=False if h=='epitrochoid' and b<=0: print "In a epitrochoid, radius must be positive" |
if h == 'hypotrochoid' and (b >= 1 or b <= 0): print("In a hypotrochoid, radius must be between 0 and 1.") draw = False if h == 'epitrochoid' and b <= 0: print("In a epitrochoid, radius must be positive") |
Sage Interactions - Graphics
goto interact main page
Contents
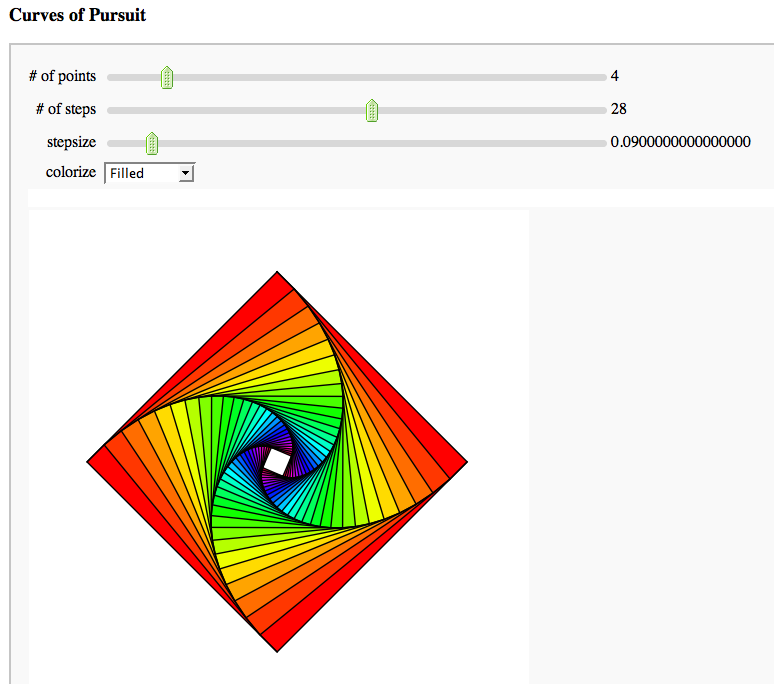
Curves of Pursuit
by Marshall Hampton.
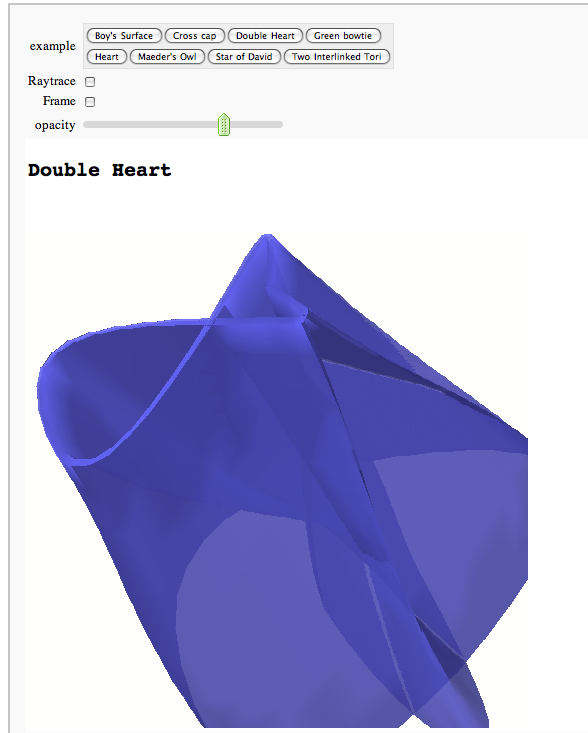
Catalog of 3D Parametric Plots
Interactive rotatable raytracing with Tachyon3d
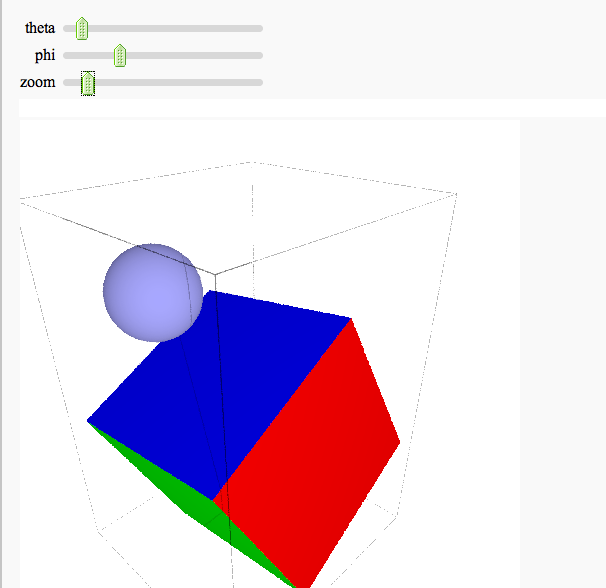
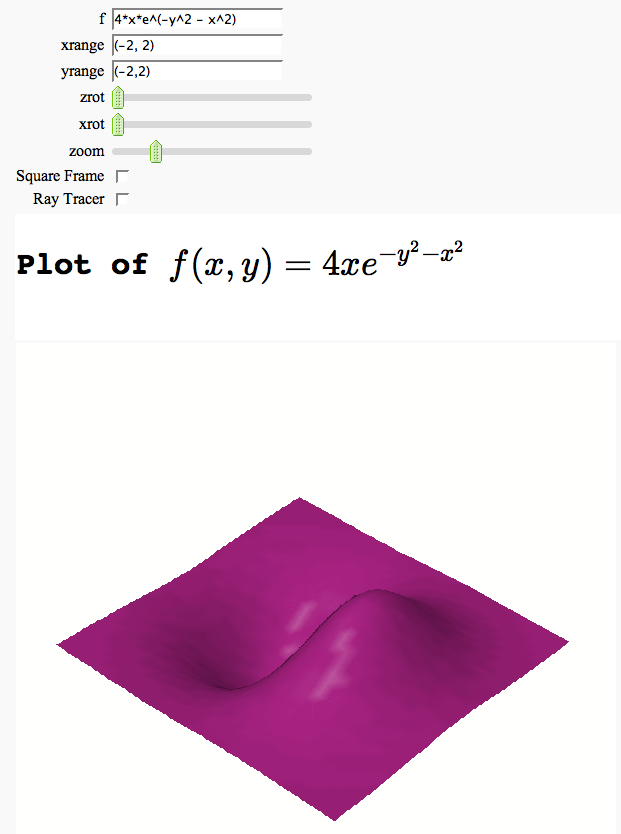
Interactive 3d plotting
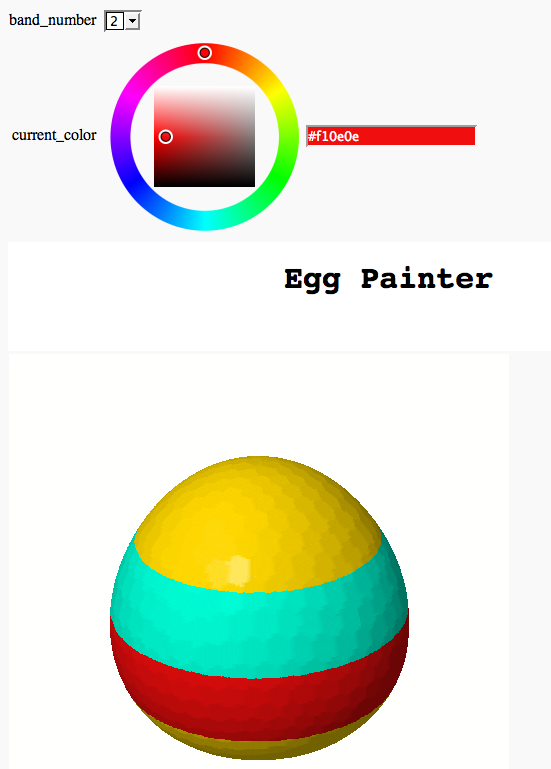
Somewhat Silly Egg Painter
by Marshall Hampton (refereed by William Stein)
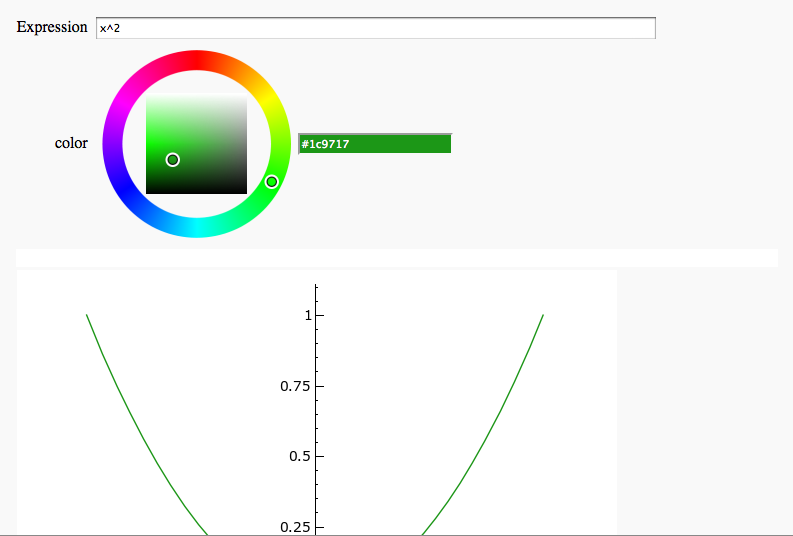
Plot Coloring
by Timothy Clemans
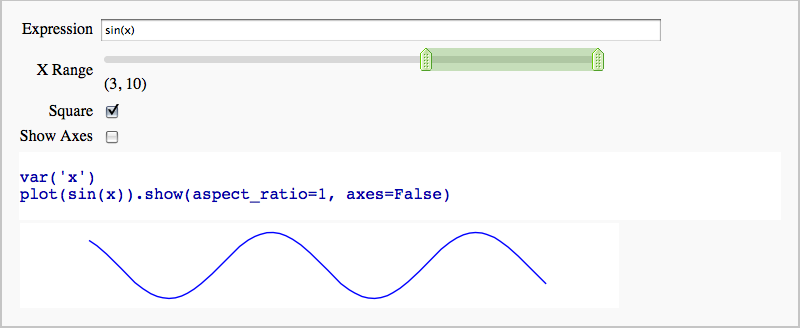
Interactive 2D Plotting
by Timothy Clemans
Interact with matplotlib
Spirograph
