|
Size: 3213
Comment: converted to 1.6 markup
|
Size: 5481
Comment:
|
| Deletions are marked like this. | Additions are marked like this. |
| Line 8: | Line 8: |
| {{{ | {{{#!sagecell |
| Line 51: | Line 51: |
| {{{ | {{{#!sagecell |
| Line 74: | Line 74: |
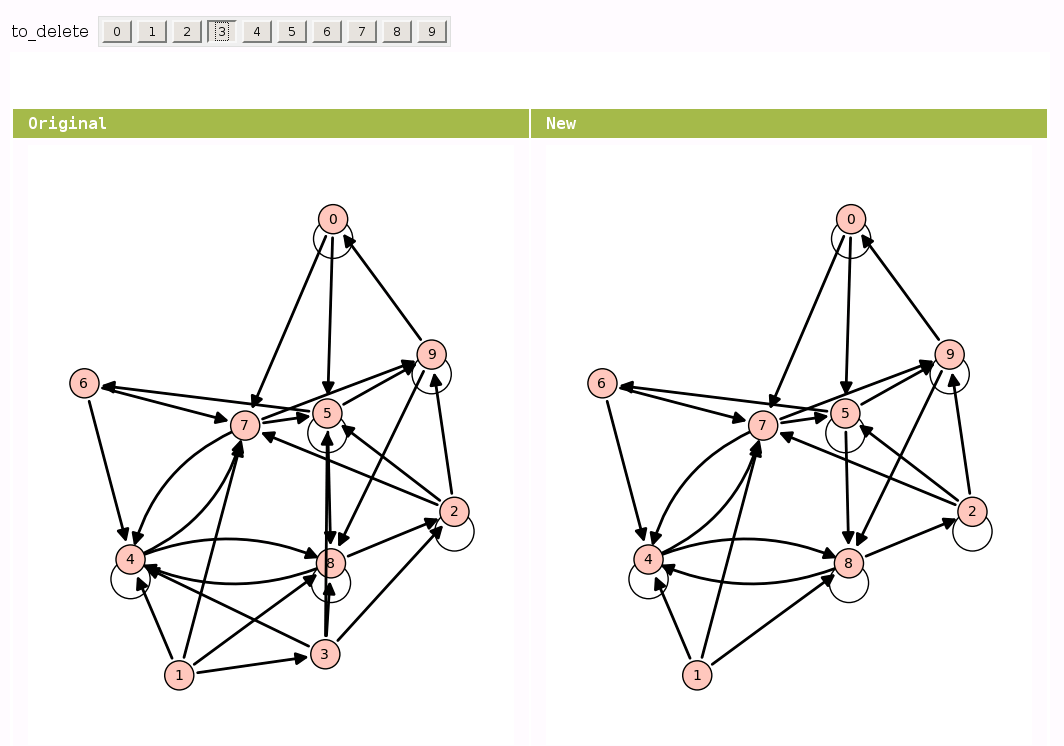
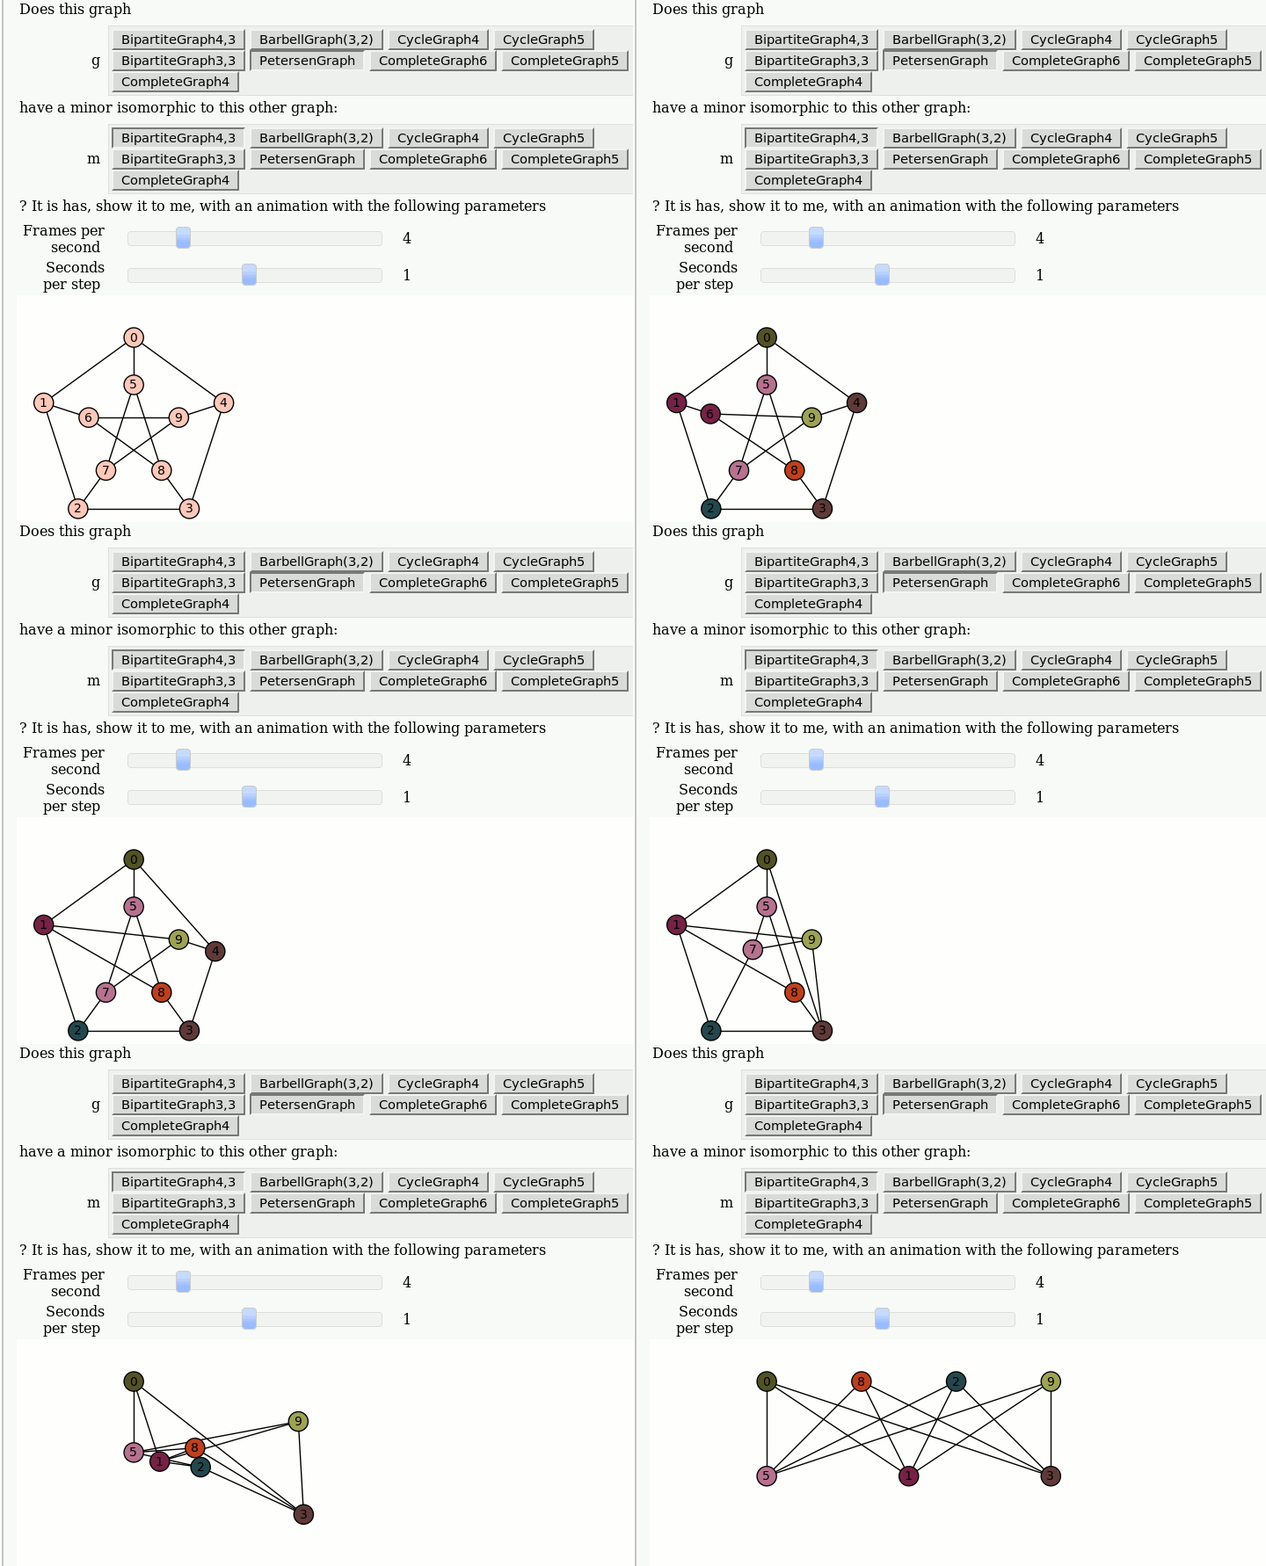
== View an induced subgraph == by Jason Grout {{{#!sagecell m=random_matrix(ZZ,10,density=.5) a=DiGraph(m) @interact def show_subgraph(to_delete=selector(range(10),buttons=True)): vertices=set(range(10)) subgraph_vertices=vertices.difference([to_delete]) html.table([["Original", "New"], [plot(a,save_pos=True), plot(a.subgraph(subgraph_vertices))]], header=True) }}} {{attachment:subgraph-interact.png}} == Animations of Graph Minors == by Pablo Angulo Note: you should use "Upload" or "Create a new file" to attach to the worksheet a file called wagner.sage with the following [[interact/graph_theory/wagner.sage| content]], and then you can use the code below: {{{#!sagecell attach(DATA + 'wagner.sage') graph_list = {'CompleteGraph4':graphs.CompleteGraph(4), 'CompleteGraph5':graphs.CompleteGraph(5), 'CompleteGraph6':graphs.CompleteGraph(6), 'BipartiteGraph3,3':graphs.CompleteBipartiteGraph(3,3), 'BipartiteGraph4,3':graphs.CompleteBipartiteGraph(4,3), 'PetersenGraph':graphs.PetersenGraph(), 'CycleGraph4':graphs.CycleGraph(4), 'CycleGraph5':graphs.CycleGraph(5), 'BarbellGraph(3,2)':graphs.BarbellGraph(3,2) } @interact def _(u1 = text_control(value='Does this graph'), g = selector(graph_list.keys(), buttons = True), u2 = text_control(value='have a minor isomorphic to this other graph:'), m = selector(graph_list.keys(), buttons = True), u3 = text_control(value='''? It is has, show it to me, with an animation with the following parameters'''), frames = slider(1,15,1,4, label = 'Frames per second'), step_time = slider(1/10,2,1/10,1, label = 'Seconds per step')): g = graph_list[g] m = graph_list[m] if g == m: html('<h3>Please select two different graphs</h3>') return try: a = animate_minor(g, m, frames = frames) a.show(delay=100*step_time/frames) except ValueError: html('''<h3>The first graph have <strong>NO</strong> minor isomorphic to the second</h3>''') }}} {{attachment:wagner.gif}} |
Sage Interactions - Graph Theory
goto interact main page
Contents
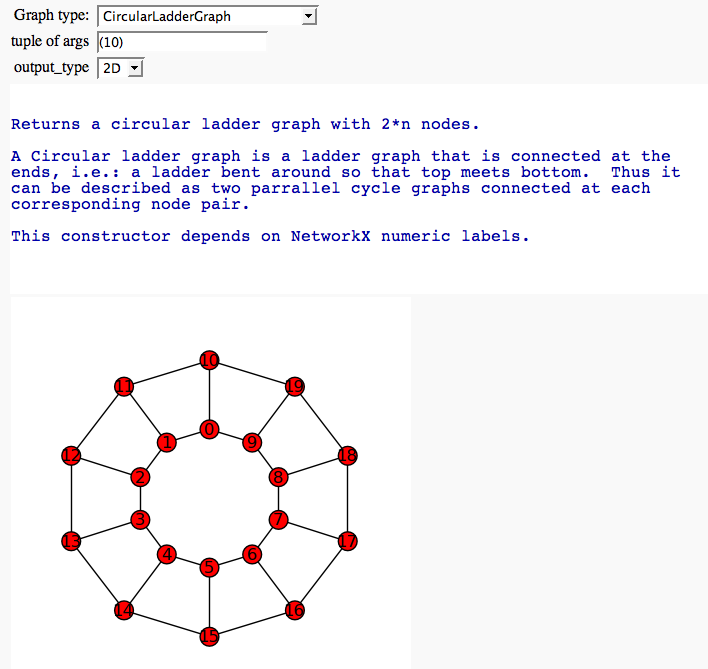
Graph Browser
by Marshall Hampton

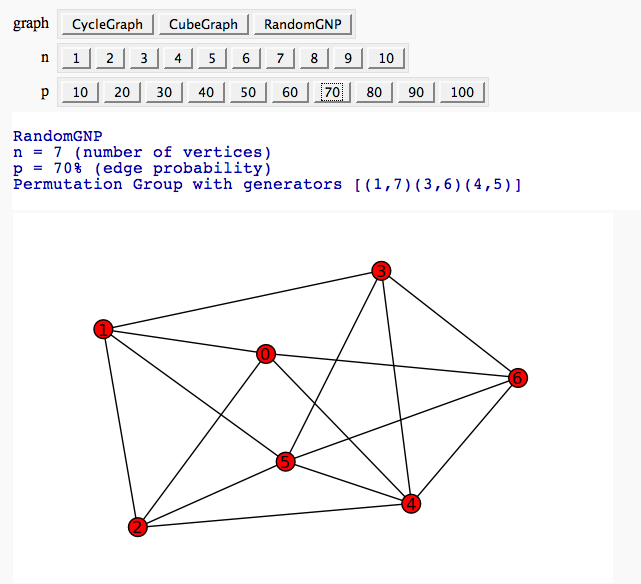
Automorphism Groups of some Graphs
by William Stein:

View an induced subgraph
by Jason Grout

Animations of Graph Minors
by Pablo Angulo
Note: you should use "Upload" or "Create a new file" to attach to the worksheet a file called wagner.sage with the following content, and then you can use the code below:

