|
Size: 3213
Comment: converted to 1.6 markup
|
Size: 3673
Comment:
|
| Deletions are marked like this. | Additions are marked like this. |
| Line 74: | Line 74: |
== View an induced subgraph == by Jason Grout {{{ m=random_matrix(ZZ,10,density=.5) a=DiGraph(m) @interact def show_subgraph(to_delete=selector(range(10),buttons=True)): vertices=set(range(10)) subgraph_vertices=vertices.difference([to_delete]) html.table([["Original", "New"], [plot(a,save_pos=True), plot(a.subgraph(subgraph_vertices))]], header=True) }}} {{attachment:subgraph-interact.png}} |
Sage Interactions - Graph Theory
goto interact main page
Contents
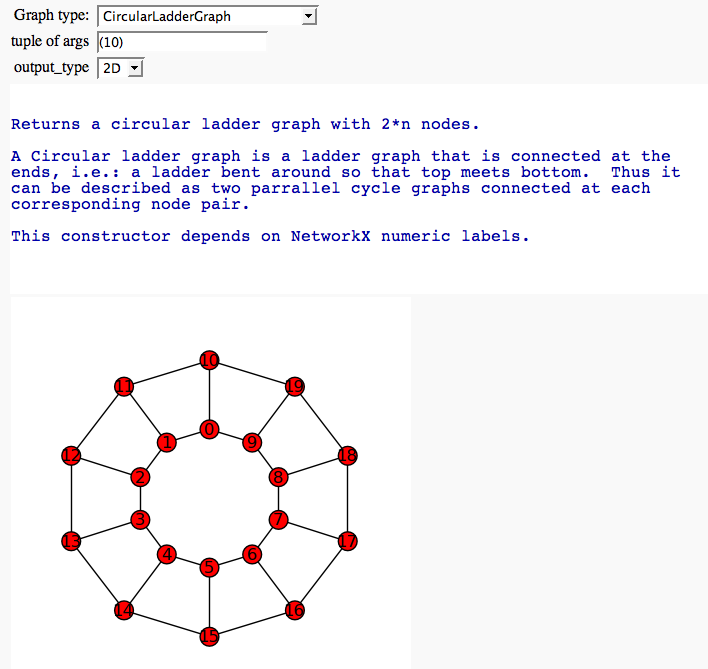
Graph Browser
by Marshall Hampton
grs = ['BalancedTree', 'BullGraph', 'ChvatalGraph', 'CirculantGraph', 'CircularLadderGraph', 'ClawGraph', 'CompleteBipartiteGraph', 'CompleteGraph', 'CubeGraph', 'CycleGraph', 'DegreeSequence', 'DegreeSequenceConfigurationModel', 'DegreeSequenceExpected', 'DegreeSequenceTree', 'DesarguesGraph', 'DiamondGraph', 'DodecahedralGraph', 'DorogovtsevGoltsevMendesGraph', 'EmptyGraph', 'FlowerSnark', 'FruchtGraph', 'Grid2dGraph', 'GridGraph', 'HeawoodGraph', 'HexahedralGraph', 'HoffmanSingletonGraph', 'HouseGraph', 'HouseXGraph', 'IcosahedralGraph', 'KrackhardtKiteGraph', 'LCFGraph', 'LadderGraph', 'LollipopGraph', 'MoebiusKantorGraph', 'OctahedralGraph', 'PappusGraph', 'PathGraph', 'PetersenGraph', 'RandomBarabasiAlbert', 'RandomGNM', 'RandomGNP', 'RandomHolmeKim', 'RandomLobster', 'RandomNewmanWattsStrogatz', 'RandomRegular', 'RandomTreePowerlaw', 'StarGraph', 'TetrahedralGraph', 'ThomsenGraph', 'WheelGraph']
examples = {}
for g in grs:
    docs = eval('graphs.' + g + '.__doc__')
    for docline in docs.split('\n'):
        ex_loc = docline.find('graphs.' + g)
        if ex_loc != -1:
            end_paren_loc = docline[ex_loc:].find(')')
            ex_str = docline[ex_loc:end_paren_loc+ex_loc+1]
            ex_str = ex_str.replace('i+','2+')
            ex_str = ex_str.replace('(i','(4')
            break
    try:
        gt2 = eval(ex_str)
        examples[g] = ex_str
    except:
        grs.remove(g)
@interact
def graph_browser(graph_name = selector(grs, label = "Graph type:"), newargs = input_box('',type=str,label='tuple of args'), output_type = selector(['2D','3D'], default='2D')):
    base_g_str = 'graphs.' + graph_name
    docs = eval(base_g_str + '.__doc__')
    doc_ex_loc = docs.find('EXAMPLE')
    if docs.find('PLOTTING') != -1:
        doc_ex_loc = min(doc_ex_loc, docs.find('PLOTTING'))
    print docs[0:doc_ex_loc].replace('\n        ','\n')
    if newargs != '':
        try:
            t_graph = eval(base_g_str + newargs)
        except:
            print "Invalid arguments, using default"
            t_graph = eval(examples[graph_name])
    else:
        t_graph = eval(examples[graph_name])
    if output_type == '2D': show(t_graph)
    if output_type == '3D': t_graph.show3d()
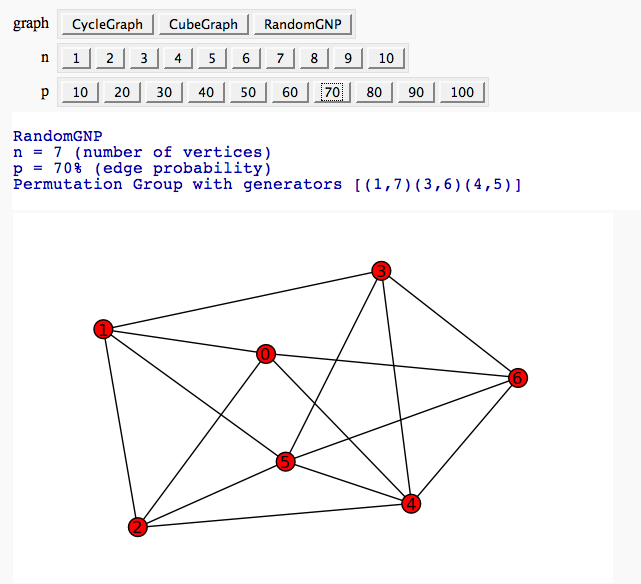
Automorphism Groups of some Graphs
by William Stein:
@interact
def _(graph=['CycleGraph', 'CubeGraph', 'RandomGNP'],
      n=selector([1..10],nrows=1), p=selector([10,20,..,100],nrows=1)):
    print graph
    if graph == 'CycleGraph':
       print "n = %s (number of vertices)"%n
       G = graphs.CycleGraph(n)
    elif graph == 'CubeGraph':
       if n > 8:
           print "n reduced to 8"
           n = 8
       print "n = %s (dimension)"%n
       G = graphs.CubeGraph(n)
    elif graph == 'RandomGNP':
       print "n = %s (number of vertices)"%n
       print "p = %s%% (edge probability)"%p
       G = graphs.RandomGNP(n, p/100.0)
    print G.automorphism_group()
    show(plot(G))
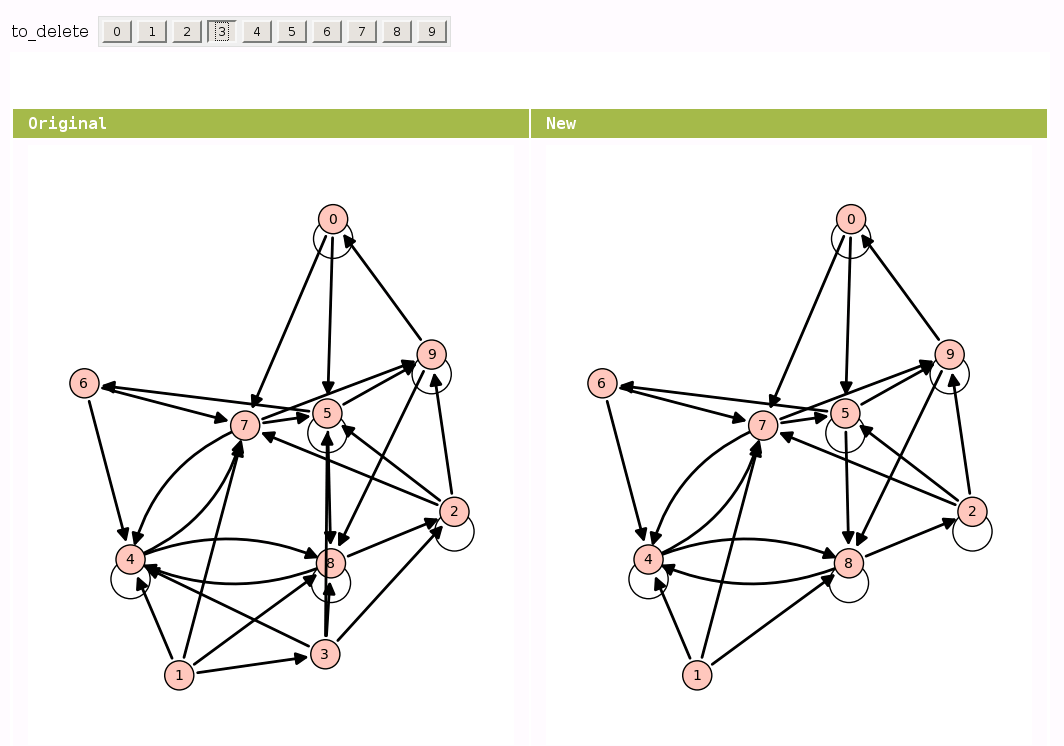
View an induced subgraph
by Jason Grout
m=random_matrix(ZZ,10,density=.5)
a=DiGraph(m)

@interact
def show_subgraph(to_delete=selector(range(10),buttons=True)):
    vertices=set(range(10))
    subgraph_vertices=vertices.difference([to_delete])
    html.table([["Original", "New"],
               [plot(a,save_pos=True), plot(a.subgraph(subgraph_vertices))]],
               header=True)
