|
Size: 5441
Comment: minor changes
|
Size: 9935
Comment: no xrange
|
| Deletions are marked like this. | Additions are marked like this. |
| Line 8: | Line 8: |
| {{{ | {{{#!sagecell |
| Line 33: | Line 33: |
| print docs[0:doc_ex_loc].replace('\n ','\n') | print(docs[0:doc_ex_loc].replace('\n ','\n')) |
| Line 38: | Line 38: |
| print "Invalid arguments, using default" | print("Invalid arguments, using default") |
| Line 51: | Line 51: |
| {{{ | {{{#!sagecell |
| Line 55: | Line 55: |
| print graph | print(graph) |
| Line 57: | Line 57: |
| print "n = %s (number of vertices)"%n | print("n = %s (number of vertices)" % n) |
| Line 61: | Line 61: |
| print "n reduced to 8" | print("n reduced to 8") |
| Line 63: | Line 63: |
| print "n = %s (dimension)"%n | print("n = %s (dimension)" % n) |
| Line 66: | Line 66: |
| print "n = %s (number of vertices)"%n print "p = %s%% (edge probability)"%p G = graphs.RandomGNP(n, p/100.0) print G.automorphism_group() |
print("n = %s (number of vertices)" % n) print("p = %s%% (edge probability)" % p) G = graphs.RandomGNP(n, p / 100.0) print(G.automorphism_group()) |
| Line 78: | Line 78: |
| {{{ | {{{#!sagecell |
| Line 97: | Line 97: |
| Note: you should use "Upload" or "Create a new file" to attach to the worksheet a file called wagner.sage with the following [[interact/graph_theory/wagner.sage| content]], and then you can use the code below: {{{ attach(DATA + 'wagner.sage') |
{{{#!sagecell def animate_contraction(g, e, frames = 12, **kwds): v1, v2 = e if not g.has_edge(v1,v2): raise ValueError, "Given edge not found on Graph" ls = [] posd = g.get_pos() for j in range(frames): gp = Graph(g) posdp = dict(posd) p1 = posdp[v1] p2 = posdp[v2] posdp[v2] = [a*(frames-j)/frames + b*j/frames for a,b in zip(p2,p1)] gp.set_pos(posdp) ls.append(plot(gp, **kwds)) return ls def animate_vertex_deletion(g, v, frames = 12, **kwds): kwds2 = dict(kwds) if 'vertex_colors' in kwds: cs = dict(kwds['vertex_colors']) for c, vs in kwds['vertex_colors'].items(): if v in vs: vs2 = list(vs) vs2.remove(v) cs[c] = vs2 kwds2['vertex_colors'] = cs else: kwds2 = dict(kwds) g2 = Graph(g) posd = dict(g.get_pos()) del posd[v] g2.delete_vertex(v) g2.set_pos(posd) return [plot(g, **kwds),plot(g2, **kwds2)]*int(frames/2) def animate_edge_deletion(g, e, frames = 12, **kwds): v1, v2 = e g2 = Graph(g) g2.delete_edge(e) return [plot(g, **kwds),plot(g2, **kwds)]*int(frames/2) def animate_glide(g, pos1, pos2, frames = 12, **kwds): ls = [] for j in range(frames): gp = Graph(g) pos = {} for v in gp.vertices(): p1 = pos1[v] p2 = pos2[v] pos[v] = [b*j/frames + a*(frames-j)/frames for a,b in zip(p1,p2)] gp.set_pos(pos) ls.append(plot(gp, **kwds)) return ls def medio(p1, p2): return tuple((a+b)/2 for a,b in zip(p1, p2)) def new_color(): return (0.1+0.8*random(), 0.1+0.8*random(), 0.1+0.8*random()) def animate_minor(g, m, frames = 12, pause = 50, step_time = 100): '''Crea una animación que muestra cómo un grafo tiene un menor m ''' posd = dict(g.get_pos()) posg = posd.values() posm = m.get_pos().values() xmax = max(max(x for x,y in posg), max(x for x,y in posm)) ymax = max(max(y for x,y in posg), max(y for x,y in posm)) xmin = min(min(x for x,y in posg), min(x for x,y in posm)) ymin = min(min(y for x,y in posg), min(y for x,y in posm)) dd = g.minor(m) #Set colors m_colors = dict((v,new_color()) for v in m.vertices()) g_colors = dict((m_colors[k],vs) for k,vs in dd.items()) extra_vs = (set(g.vertices()) - set(v for vs in dd.values() for v in vs)) g_colors[(0,0,0)] = list(extra_vs) #pics contains the frames of the animation #no colors at the beggining gg = Graph(g) pics = [plot(gg)]*frames #First: eliminate extra vertices for v in extra_vs: pics.extend(animate_vertex_deletion(gg, v, frames, vertex_colors = g_colors)) gg.delete_vertex(v) del posd[v] g_colors[(0,0,0)].remove(v) del g_colors[(0,0,0)] #Second: contract edges for color, vs in g_colors.items(): while len(vs) > 1: for j in range(1, len(vs)): if gg.has_edge(vs[0], vs[j]): break pics.extend(animate_contraction(gg, (vs[0], vs[j]), frames, vertex_colors = g_colors)) for v in gg.neighbors(vs[j]): gg.add_edge(vs[0],v) gg.delete_vertex(vs[j]) del posd[vs[j]] gg.set_pos(posd) posd = dict(gg.get_pos()) del vs[j] #Relabel vertices of m so that they match with those of gg m = Graph(m) dd0 = dict((k, vs[0]) for k,vs in dd.items() ) m.relabel(dd0) #Third: glide to position in m pos_m = m.get_pos() pos_g = gg.get_pos() pics.extend(animate_glide(gg, pos_g, pos_m, frames, vertex_colors = g_colors)) gg.set_pos(pos_m) #Fourth: delete redundant edges for e in gg.edges(labels = False): if not m.has_edge(e): pics.extend(animate_edge_deletion(gg, e, frames, vertex_colors = g_colors)) gg.delete_edge(*e) #And wait for a moment pics.extend([plot(gg, vertex_colors = g_colors)]*frames) return animate(pics, xmin = xmin - 0.1, xmax = xmax + 0.1, ymin = ymin - 0.1, ymax = ymax + 0.1) |
| Line 113: | Line 252: |
| g = selector(graph_list.keys(), buttons = True), | g = selector(graph_list.keys(), buttons = True,default='CompleteGraph4'), |
| Line 115: | Line 254: |
| m = selector(graph_list.keys(), buttons = True), u3 = text_control(value='''? It is has, show it to me, |
m = selector(graph_list.keys(), buttons = True,default='CycleGraph4'), u3 = text_control(value='''? If it has, show it to me, |
| Line 130: | Line 269: |
Sage Interactions - Graph Theory
goto interact main page
Contents
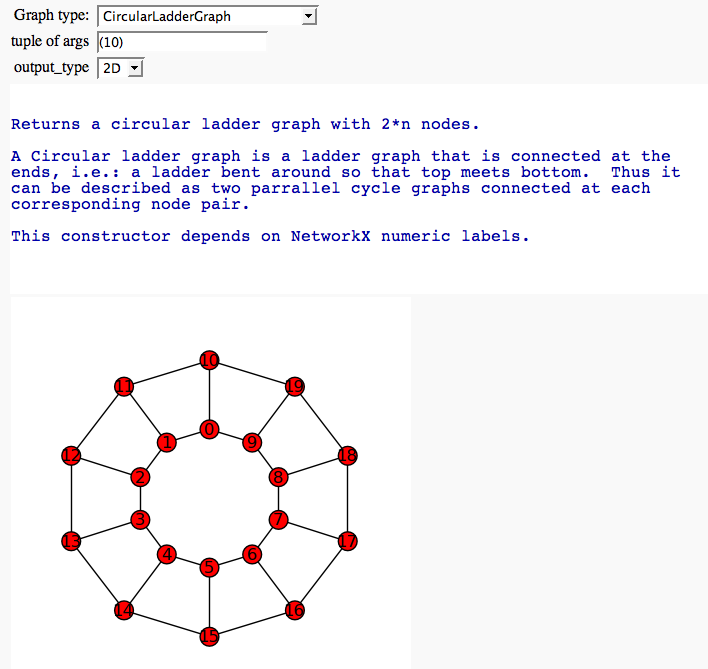
Graph Browser
by Marshall Hampton

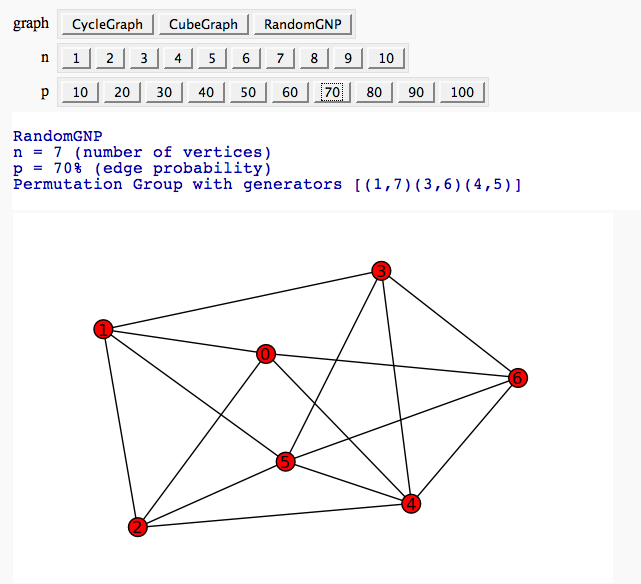
Automorphism Groups of some Graphs
by William Stein:

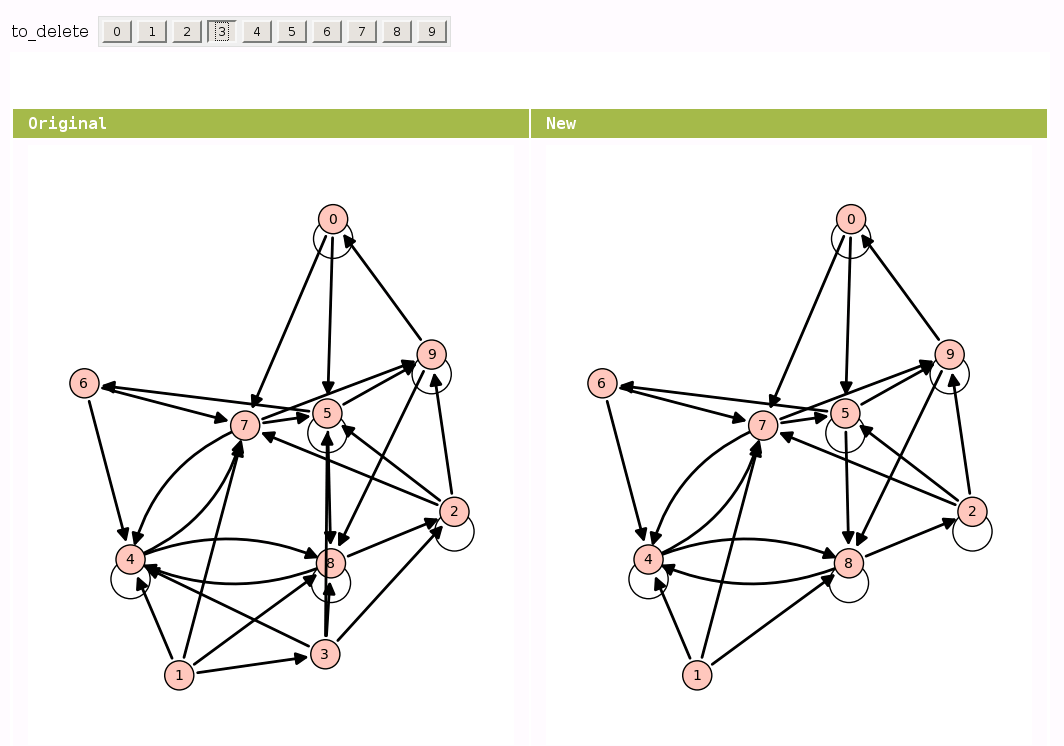
View an induced subgraph
by Jason Grout

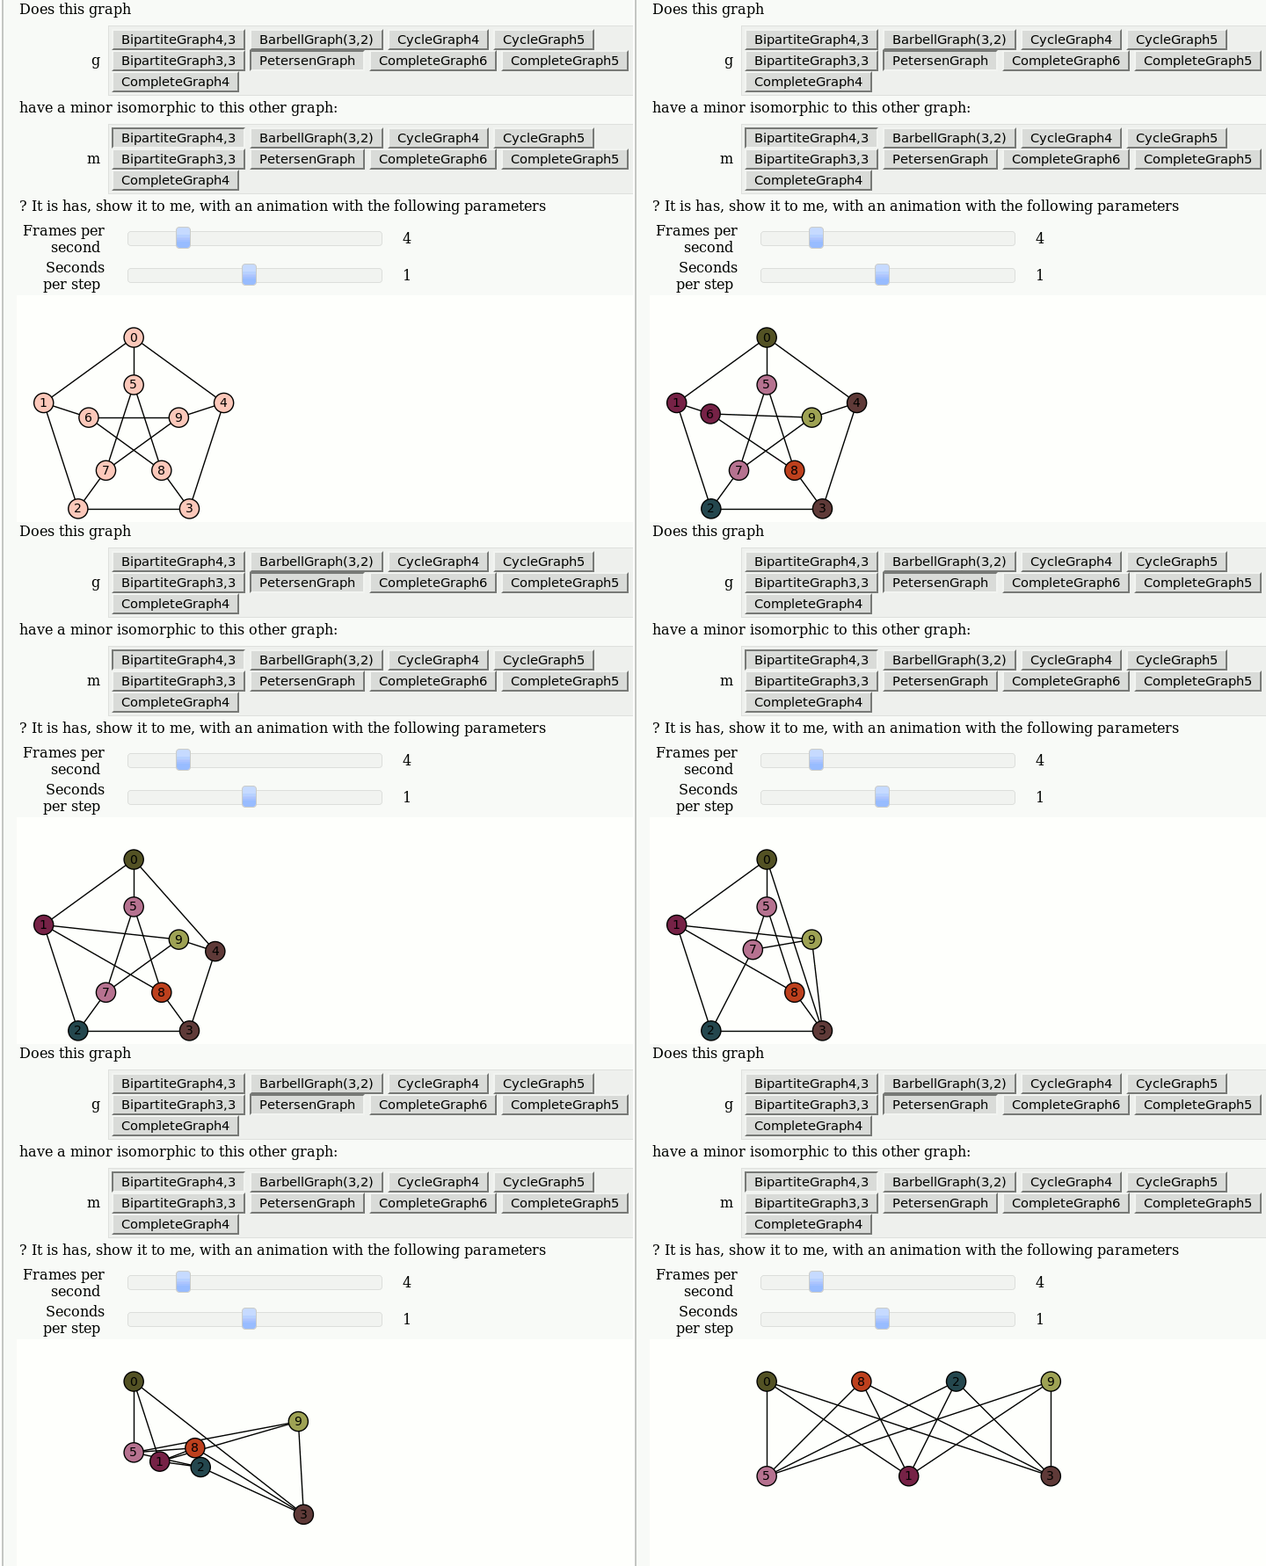
Animations of Graph Minors
by Pablo Angulo

