|
Size: 8235
Comment:
|
← Revision 41 as of 2019-04-06 16:11:28 ⇥
Size: 8098
Comment: py3 print
|
| Deletions are marked like this. | Additions are marked like this. |
| Line 8: | Line 8: |
| {{{ def muk_plot(m0,k): |
{{{#!sagecell def muk_plot(m0,k): |
| Line 12: | Line 12: |
| associated to m0, 1-m0, and k. | associated to m0, 1-m0, and k. |
| Line 32: | Line 32: |
| html("<h1>Mandelbrot's Fractal Binomial Measure</h1>") @interact def _(mu0=(0.3,(0.0001,0.999)), k=(3,(1..14)), thickness=(1.0,(0.1,0.2,..,1.0))): |
pretty_print(html("<h1>Mandelbrot's Fractal Binomial Measure</h1>")) @interact def _(mu0=slider(0.0001,0.999,default=0.3), k=slider([1..14],default=3), thickness=slider([0.1,0.2,..,1.0],default=1.0)): |
| Line 37: | Line 37: |
| line(v,thickness=thickness).show(xmin=0.5, xmax=0.5, ymin=0, figsize=[8,3]) | line(v,thickness=thickness).show(xmin=0, xmax=1, ymin=0, figsize=[8,3]) |
| Line 42: | Line 42: |
| == Fractals Generated By Digit Sets and Dilation Matrices (Sage Days 9 - Avra Laarakker) == == Attempt at Generating all integer vectors with Digits D and Matrix A (How about vector([0,-1])?) == {{{ |
== Fractals Generated By Digit Sets and Dilation Matrices == (Sage Days 9 - Avra Laarakker) Attempt at Generating all integer vectors with Digits D and Matrix A (How about vector([0,-1])?) {{{#!sagecell |
| Line 50: | Line 52: |
| def f(A = matrix([[1,1],[-1,1]]), D = '[[0,0],[1,0]]', k=(3..17)): print "Det = ", A.det() |
def f(A = matrix([[1,1],[-1,1]]), D = '[[0,0],[1,0]]', k=[3..17]): print("Det = {}".format(A.det())) |
| Line 59: | Line 61: |
| G = points([v.list() for v in Dn(k)]) |
G = points([v.list() for v in Dn(k)],size=50) |
| Line 63: | Line 65: |
| }}} {{attachment:1.png}} |
}}} {{attachment:1.png}} |
| Line 69: | Line 70: |
| {{{ | {{{#!sagecell |
| Line 74: | Line 75: |
| def f(A = matrix([[1,1],[-1,1]]), D = '[[0,0],[1,0]]', k=(3..17)): print "Det = ", A.det() |
def f(A = matrix([[1,1],[-1,1]]), D = '[[0,0],[1,0]]', k=[3..17]): print("Det = {}".format(A.det())) |
| Line 83: | Line 84: |
| Line 85: | Line 86: |
| Line 87: | Line 88: |
| Line 92: | Line 93: |
| {{{ |
{{{#!sagecell |
| Line 104: | Line 105: |
| @interact def f(A = matrix([[0,0,2],[1,0,1],[0,1,-1]]), D = '[[0,0,0],[1,0,0]]', k=(3..15), labels=True): print "Det = ", A.det() |
@interact def f(A = matrix([[0,0,2],[1,0,1],[0,1,-1]]), D = '[[0,0,0],[1,0,0]]', k=[3..15], labels=False): print("Det = {}".format(A.det())) |
| Line 109: | Line 110: |
| print "D:" print D |
print("D:") print(D) |
| Line 115: | Line 116: |
| Line 130: | Line 131: |
| def mandelbrot_cython(float x0,float x1,float y0,float y1, | def mandelbrot_cython(float x0,float x1,float y0,float y1, |
| Line 147: | Line 148: |
| while (h<L and | while (h<L and |
| Line 166: | Line 167: |
| N = slider(100, 1000,100, 300), | N = slider(100, 1000,100, 300), |
| Line 182: | Line 183: |
| elif option == 'Stay': pass else: |
elif option != 'Stay': |
| Line 186: | Line 185: |
| time m=mandelbrot_cython(x0 ,x0 + side ,y0 ,y0 + side , N, L ) |
m=mandelbrot_cython(x0 ,x0 + side ,y0 ,y0 + side , N, L ) |
| Line 194: | Line 193: |
| time pylab.savefig('mandelbrot.png') | pylab.savefig('mandelbrot.png') |
| Line 201: | Line 200: |
| published notebook: [[http://sagenb.org/pub/1299/]] | published notebook: [[https://cloud.sagemath.com/projects/19575ea0-317e-402b-be57-368d04c113db/files/pub/1201-1301/1299-Mandelbrot.sagews]] |
| Line 206: | Line 205: |
| {{{ | {{{#!sagecell |
| Line 209: | Line 208: |
| formula = list(['mandel','ff']),\ | formula = ['mandel','ff'],\ |
| Line 216: | Line 215: |
| Line 220: | Line 219: |
| ff = fast_callable(f, vars=[z,c], domain=CDF) |
ff = fast_callable(f, vars=[z,c], domain=CDF) |
| Line 229: | Line 228: |
| print 'z <- z^%s + c' % expo |
print('z <- z^%s + c' % expo) |
| Line 235: | Line 234: |
| func = mandel |
func = mandel |
| Line 243: | Line 242: |
| {{{ | {{{#!sagecell |
| Line 252: | Line 251: |
| I = CDF.gen() | I = CDF.gen() |
| Line 255: | Line 254: |
| Line 262: | Line 261: |
| print 'z <- z^%s + (%s+%s*I)' % (expo, c_real, c_imag) |
print('z <- z^%s + (%s+%s*I)' % (expo, c_real, c_imag)) |
| Line 272: | Line 271: |
| == Sierpinski's Triangle == | == Sierpiński Triangle == |
| Line 275: | Line 274: |
| {{{ %python from numpy import zeros |
{{{#!sagecell |
| Line 281: | Line 276: |
| '''Generates the Sierpinski's Triangle fractal to N iterations using the Rule 90 elementary cellular automaton. N is in powers of 2 because these produce "whole" triangles.''' M=zeros( (N,2*N+1), dtype=int) M[0,N]=1 rule=[0, 1, 0, 1, 1, 0, 1, 0] for j in range(1,N): for k in range(N-j,N+j+1): l = 4*M[j-1,k-1] + 2*M[j-1,k] + M[j-1,k+1] M[j,k]=rule[ l ] return M @interact def _(N=slider([2**a for a in range(0, 12)], label='Number of iterations',default=128), size = slider(1, 20, label= 'Size', step_size=1, default=9 )): M = sierpinski(N) plot_M = matrix_plot(M, cmap='binary') plot_M.show( figsize=[size,size]) |
'''Generates the Sierpinski triangle by taking the modulo-2 of each element in Pascal's triangle''' return [([0] * (N // 2 - a // 2)) + [binomial(a, b) % 2 for b in range(a + 1)] + ([0] * (N // 2 - a // 2)) for a in range(0, N, 2)] @interact def _(N=slider([2 ** a for a in range(12)], label='Number of iterations', default=64), size=slider(1, 20, label='Size', step_size=1, default=9)): M = sierpinski(2 * N) matrix_plot(M, cmap='binary').show(figsize=[size, size]) |
Sage Interactions - Fractal
goto interact main page
Contents
-
Sage Interactions - Fractal
- Mandelbrot's Fractal Binomial Distribution
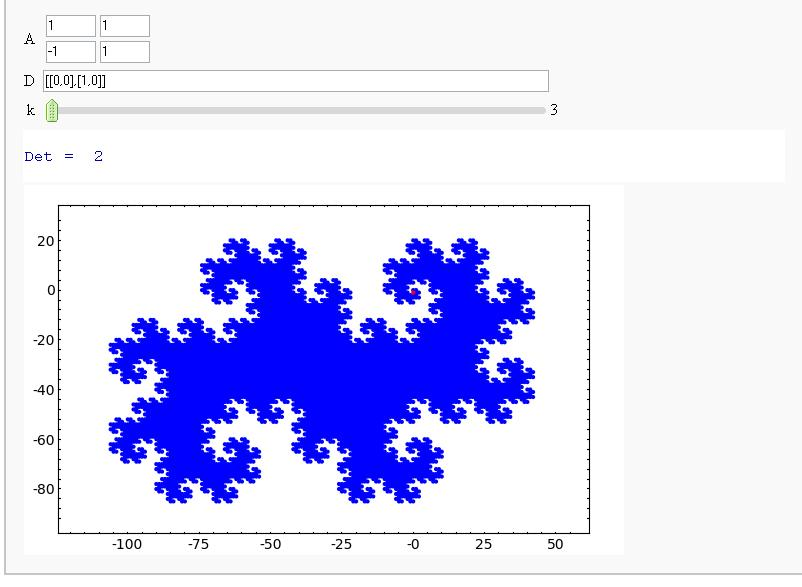
- Fractals Generated By Digit Sets and Dilation Matrices
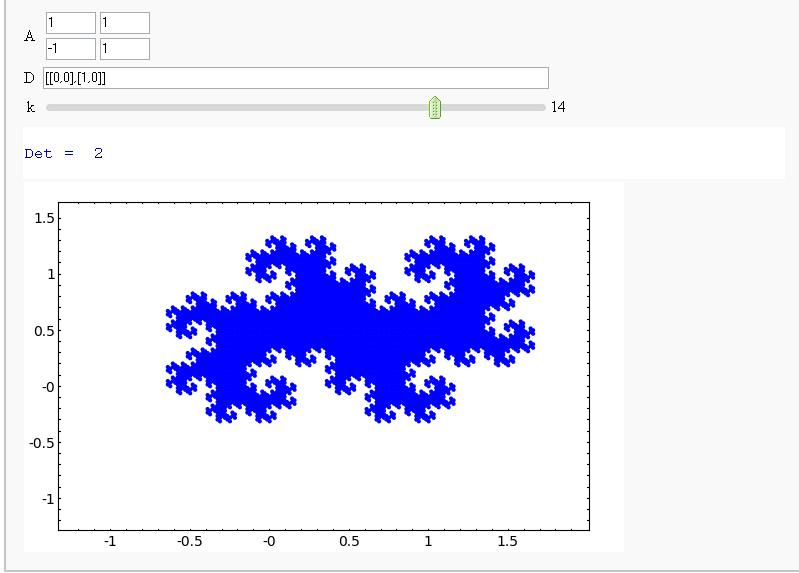
- Demonstrating that the Twin Dragon Matrix is likely to yield a Tiling of a Compact Interval of R^2 as k->infinity (It does!)
- Now in 3D
- Exploring Mandelbrot
- Mandelbrot & Julia Interact with variable exponent
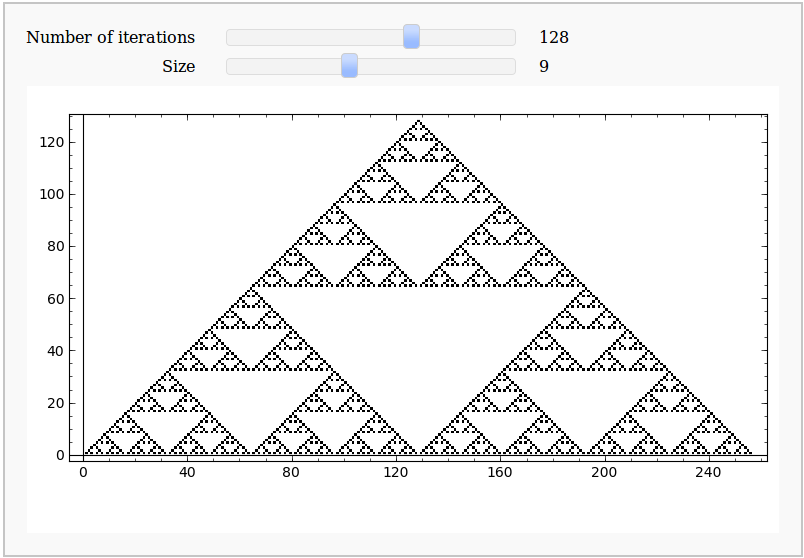
- Sierpiński Triangle
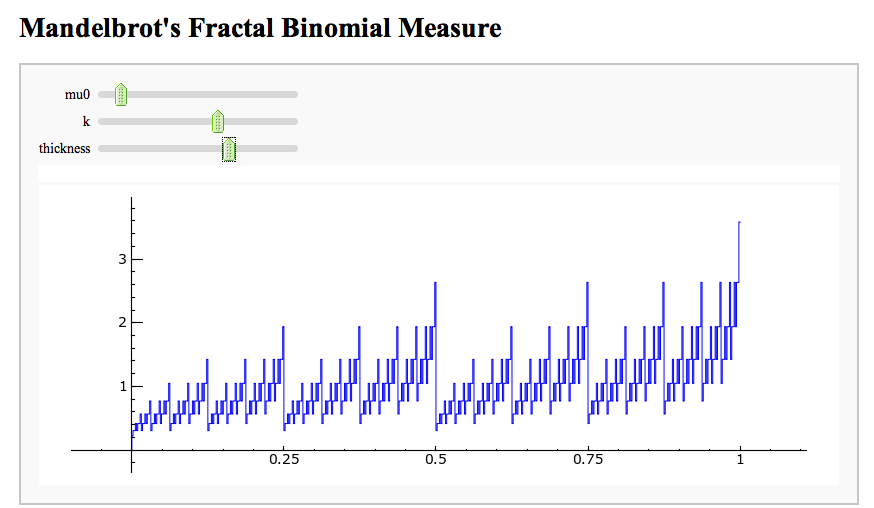
Mandelbrot's Fractal Binomial Distribution
Fractals Generated By Digit Sets and Dilation Matrices
(Sage Days 9 - Avra Laarakker)
Attempt at Generating all integer vectors with Digits D and Matrix A (How about vector([0,-1])?)
Demonstrating that the Twin Dragon Matrix is likely to yield a Tiling of a Compact Interval of R^2 as k->infinity (It does!)
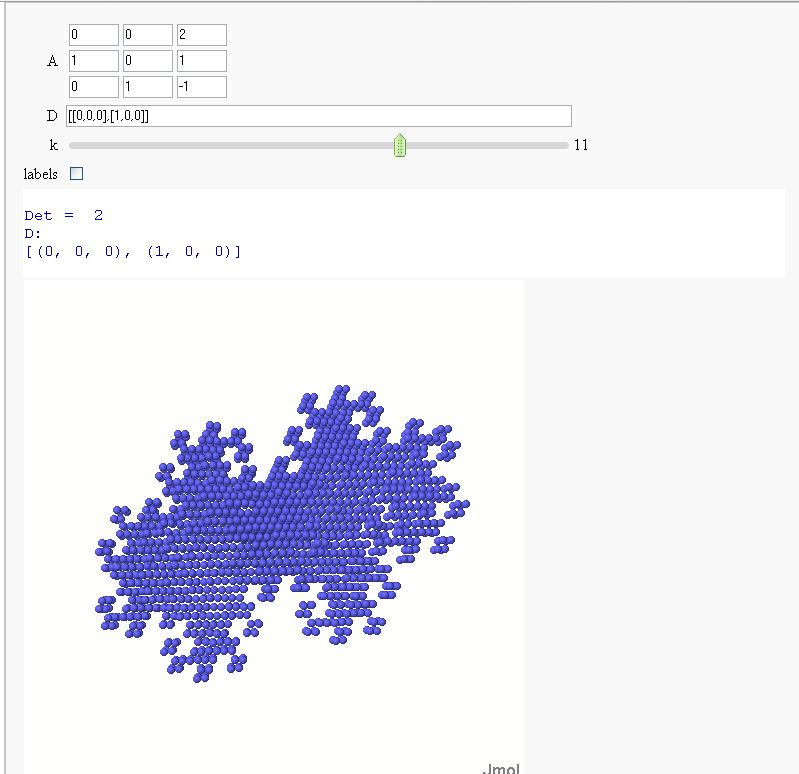
Now in 3D

Exploring Mandelbrot
Pablo Angulo
%cython
import numpy as np
cimport numpy as np

def mandelbrot_cython(float x0,float  x1,float  y0,float  y1,
                   int N=200, int L=50, float R=3):
    '''returns an array NxN to be plotted with matrix_plot
    '''
    cdef double complex c, z, I
    cdef float deltax, deltay, R2 = R*R
    cdef int h, j, k
    cdef np.ndarray[np.uint16_t, ndim=2] m
    m = np.zeros((N,N), dtype=np.uint16)
    I = complex(0,1)
    deltax = (x1-x0)/N
    deltay = (y1-y0)/N
    for j in range(N):
        for k in range(N):
            c = (x0+j*deltax)+ I*(y0+k*deltay)
            z=0
            h=0
            while (h<L and
                   z.real**2 + z.imag**2 < R2):
                z=z*z+c
                h+=1
            m[j,k]=h
    return m
import pylab
x0_default = -2
y0_default = -1.5
side_default = 3.0
side = side_default
x0 = x0_default
y0 = y0_default
options = ['Reset','Upper Left', 'Upper Right', 'Stay', 'Lower Left', 'Lower Right']
@interact
def show_mandelbrot(option = selector(options, nrows = 2, width=8),
N = slider(100, 1000,100, 300),
L = slider(20, 300, 20, 60),
plot_size = slider(2,10,1,6),
auto_update = False):
global x0, y0, side
if option == 'Lower Right':
x0 += side/2
y0 += side/2
elif option == 'Upper Right':
y0 += side/2
elif option == 'Lower Left':
x0 += side/2
if option=='Reset':
side = side_default
x0 = x0_default
y0 = y0_default
elif option != 'Stay':
side = side/2
m=mandelbrot_cython(x0 ,x0 + side ,y0 ,y0 + side , N, L )
# p = (matrix_plot(m) +
# line2d([(N/2,0),(N/2,N)], color='red', zorder=2) +
# line2d([(0,N/2),(N,N/2)], color='red', zorder=2))
# time show(p, figsize = (plot_size, plot_size))
pylab.clf()
pylab.imshow(m, cmap = pylab.cm.gray)
pylab.savefig('mandelbrot.png')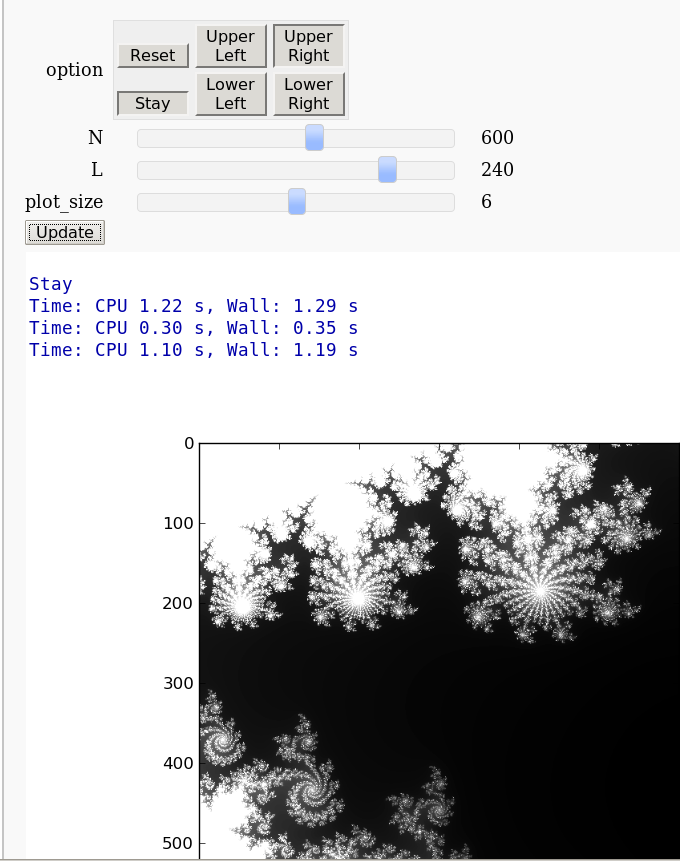
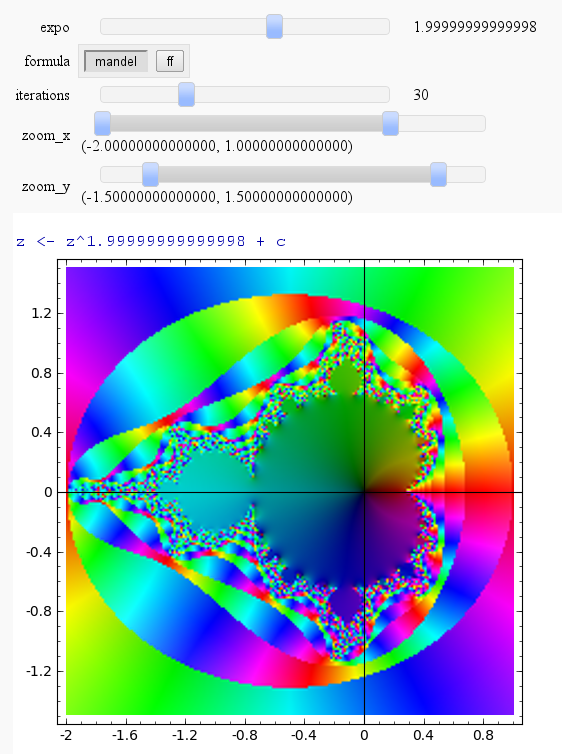
Mandelbrot & Julia Interact with variable exponent
published notebook: https://cloud.sagemath.com/projects/19575ea0-317e-402b-be57-368d04c113db/files/pub/1201-1301/1299-Mandelbrot.sagews
Mandelbrot
by Harald Schilly
Julia
by Harald Schilly
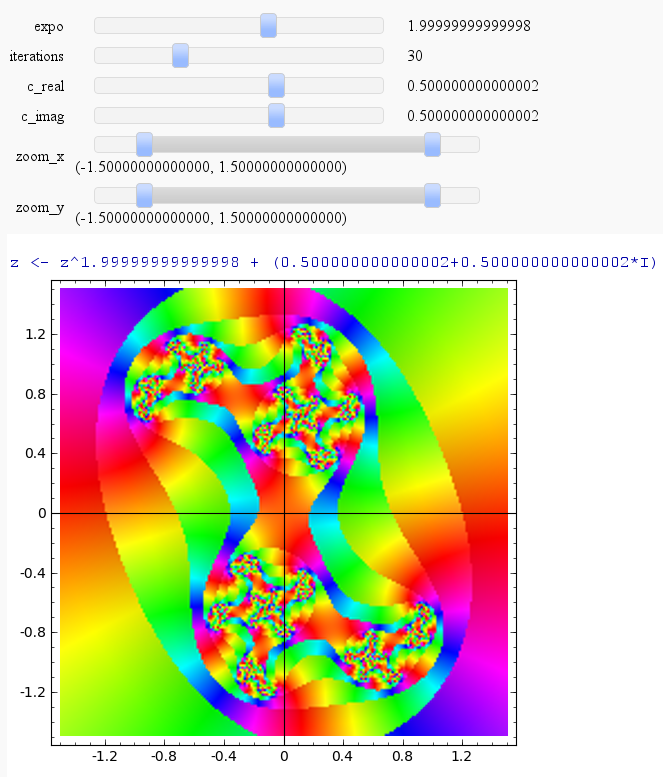
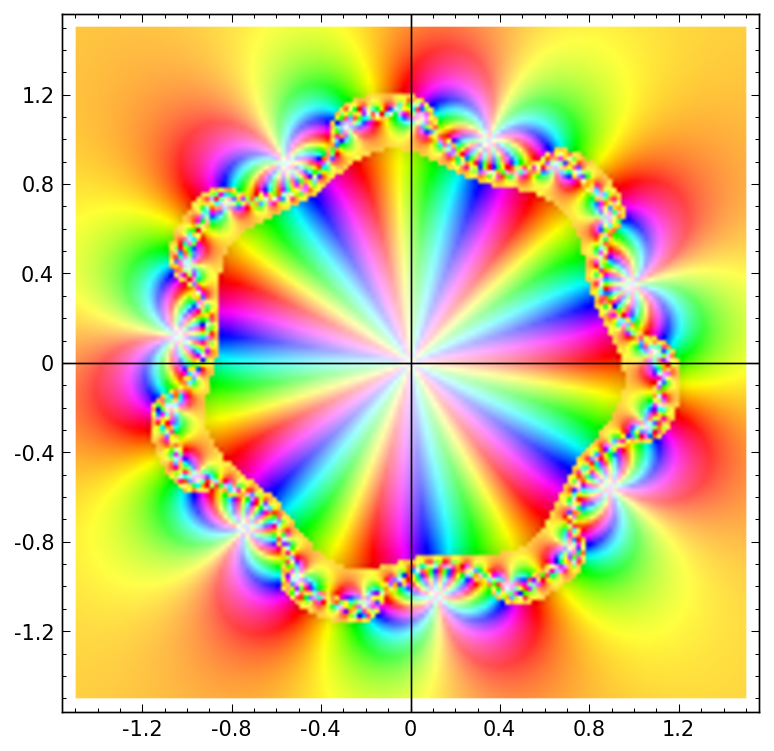
julia_plot(-7,30,0.5,0.5,(-1.5,1.5), (-1.5,1.5))
Sierpiński Triangle
by Eviatar Bach
