|
Size: 3900
Comment: added "Exploring Mandelbrot"
|
Size: 3944
Comment: added cdef for speed
|
| Deletions are marked like this. | Additions are marked like this. |
| Line 131: | Line 131: |
| cdef complex c,z cdef int h, i, k |
Sage Interactions - Fractal
goto interact main page
Contents
-
Sage Interactions - Fractal
- Mandelbrot's Fractal Binomial Distribution
- Fractals Generated By Digit Sets and Dilation Matrices (Sage Days 9 - Avra Laarakker)
- Attempt at Generating all integer vectors with Digits D and Matrix A (How about vector([0,-1])?)
- Demonstrating that the Twin Dragon Matrix is likely to yield a Tiling of a Compact Interval of R^2 as k->infinity (It does!)
- Now in 3d
- Exploring Mandelbrot
Mandelbrot's Fractal Binomial Distribution
def muk_plot(m0,k):
    """
    Return a plot of the binomial fractal measure mu_k
    associated to m0, 1-m0, and k.
    """
    k = int(k)
    m0 = float(m0)
    m1 = float(1 - m0)
    assert m0 > 0 and m1 > 0, "both must be positive"
    v = [(0,0)]
    t = 0
    two = int(2)
    delta = float(1/2^k)
    multiplier = float(2^k)
    for i in [0..2^k-1]:
        t = i * delta
        phi1 = i.str(two).count("1")
        phi0 = k - phi1
        y = m0^(phi0)*m1^(phi1)*multiplier
        v.append((t,y))
        v.append((t+delta,y))
    return v

html("<h1>Mandelbrot's Fractal Binomial Measure</h1>")

@interact
def _(mu0=(0.3,(0.0001,0.999)), k=(3,(1..14)), thickness=(1.0,(0.1,0.2,..,1.0))):
    v = muk_plot(mu0,k)
    line(v,thickness=thickness).show(xmin=0.5, xmax=0.5, ymin=0, figsize=[8,3])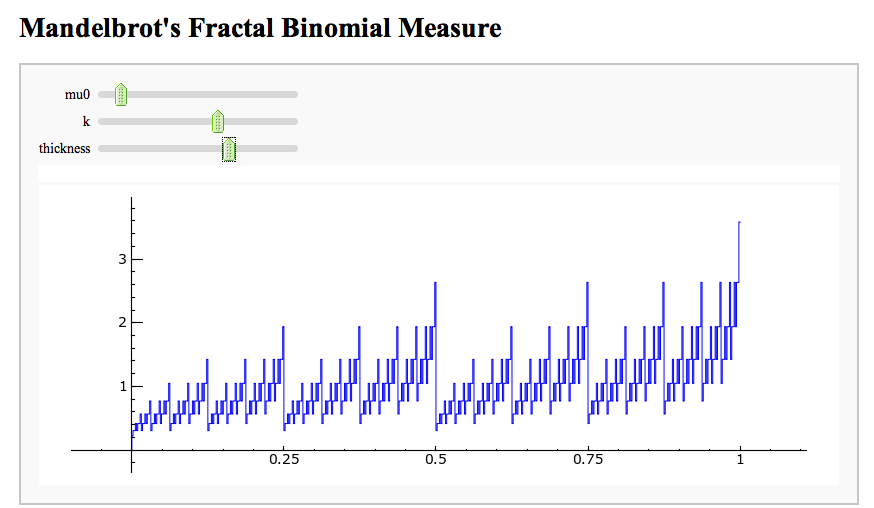
Fractals Generated By Digit Sets and Dilation Matrices (Sage Days 9 - Avra Laarakker)
Attempt at Generating all integer vectors with Digits D and Matrix A (How about vector([0,-1])?)
A = matrix([[1,1],[-1,1]])
D = [vector([0,0]), vector([1,0])]

@interact
def f(A = matrix([[1,1],[-1,1]]), D = '[[0,0],[1,0]]', k=(3..17)):
    print "Det = ", A.det()
    D = matrix(eval(D)).rows()
    def Dn(k):
        ans = []
        for d in Tuples(D, k):
            s = sum(A^n*d[n] for n in range(k))
            ans.append(s)
        return ans

    G = points([v.list() for v in Dn(k)])

    show(G, frame=True, axes=False)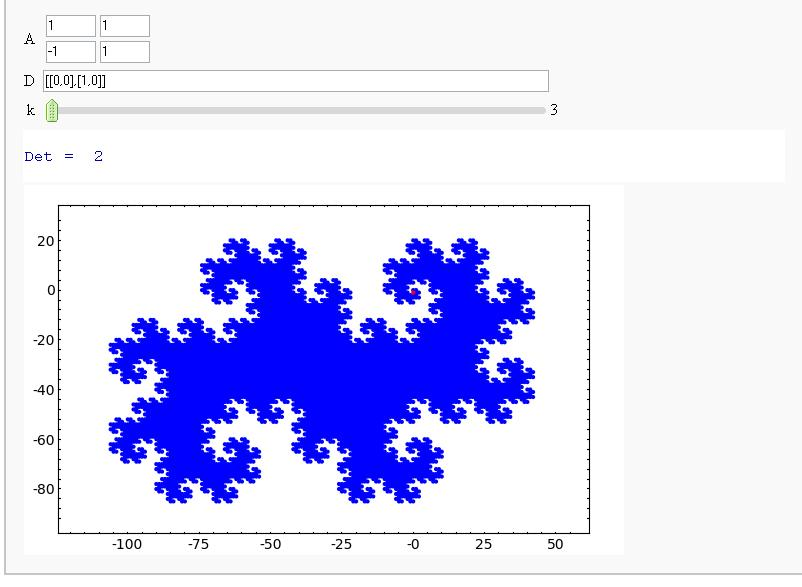
Demonstrating that the Twin Dragon Matrix is likely to yield a Tiling of a Compact Interval of R^2 as k->infinity (It does!)
A = matrix([[1,1],[-1,1]])
D = [vector([0,0]), vector([1,0])]

@interact
def f(A = matrix([[1,1],[-1,1]]), D = '[[0,0],[1,0]]', k=(3..17)):
    print "Det = ", A.det()
    D = matrix(eval(D)).rows()
    def Dn(k):
        ans = []
        for d in Tuples(D, k):
            s = sum(A^(-n)*d[n] for n in range(k))
            ans.append(s)
        return ans

    G = points([v.list() for v in Dn(k)])

    show(G, frame=True, axes=False)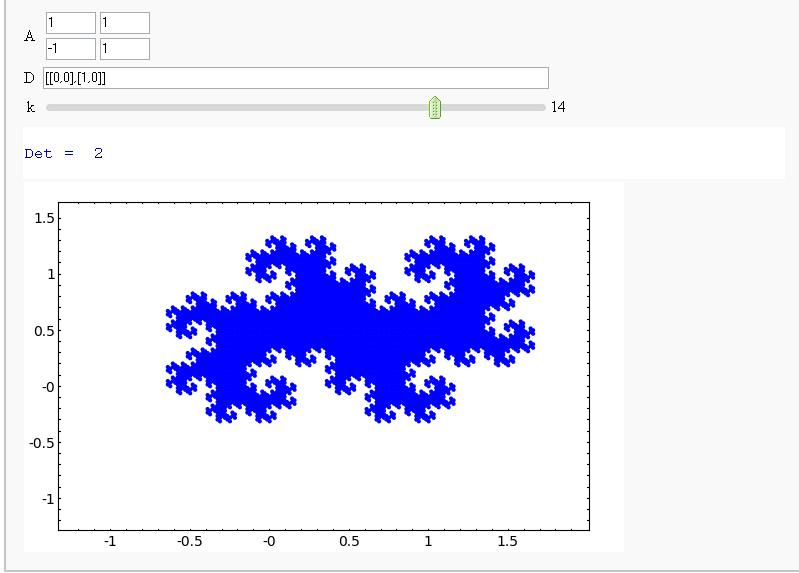
Now in 3d
A = matrix([[0,0,2],[1,0,1],[0,1,-1]])
D = '[[0,0,0],[1,0,0]]'

def Dn(D,A,k):
    ans = []
    for d in Tuples(D, k):
        s = sum(A^n*d[n] for n in range(k))
        ans.append(s)
    return ans

@interact
def f(A = matrix([[0,0,2],[1,0,1],[0,1,-1]]), D = '[[0,0,0],[1,0,0]]', k=(3..15), labels=True):
    print "Det = ", A.det()
    D = matrix(eval(D)).rows()
    print "D:"
    print D
    G = point3d([v.list() for v in Dn(D,A,k)], size=8)#, opacity=.85)
    if labels:
        G += sum([text3d(str(v),v) for v in Dn(D,A,k)])
    show(G, axes=False, frame=False)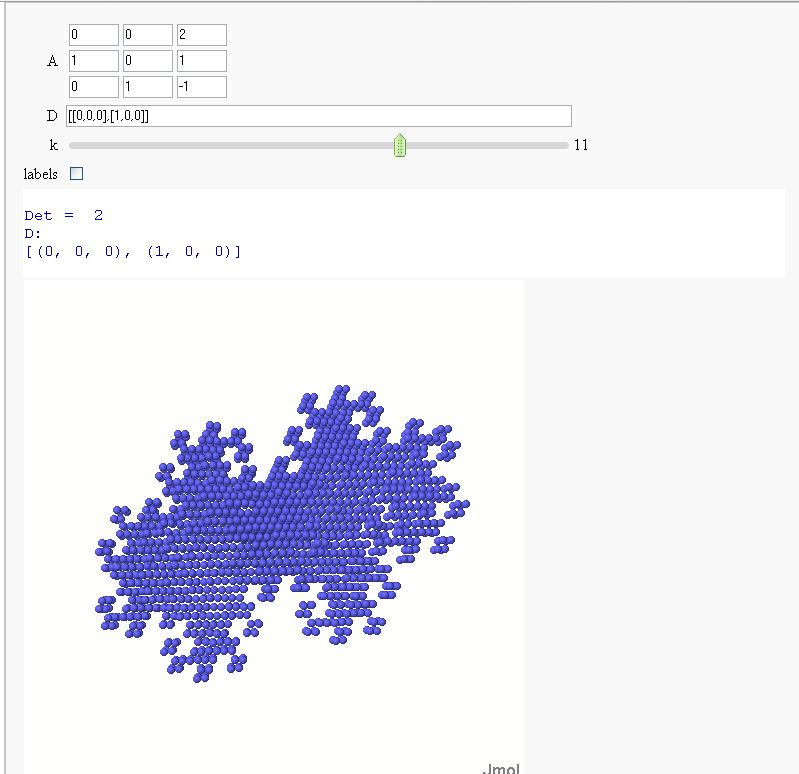

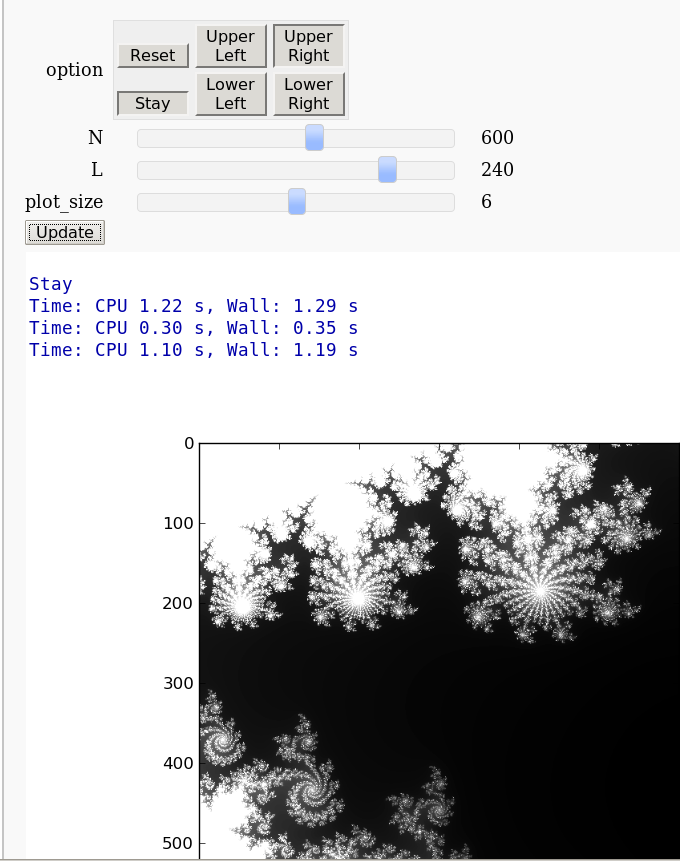
Exploring Mandelbrot
Pablo Angulo
%cython
import numpy as np
def mandelbrot_cython(float x0,float  x1,float  y0,float  y1,int N=200, int L=50, float R=3):
    '''returns an array NxN to be plotted with matrix_plot
    '''
    cdef complex c,z
    cdef int h, i, k
    m= np.zeros([N,N], dtype=np.int)
    for i in range(N):
        for k in range(N):
            c=complex(x0+i*(x1-x0)/N, y0+k*(y1-y0)/N)
            z=complex(0,0)
            h=0
            while (h<L) and (abs(z)<R):
                z=z*z+c
                h+=1
            m[i,k]=h
    return m
@interact
def showme_mandelbrot(x0=-2, y0=-1.5, side=3.0,N=(100*i for i in range(1,11)), L=(20*i for i in range(1,11)) ):
time m=mandelbrot_cython(x0 ,x0 + side ,y0 ,y0 + side , N, L )
time show(matrix_plot(m))