|
Size: 2878
Comment:
|
Size: 2887
Comment: converted to 1.6 markup
|
| Deletions are marked like this. | Additions are marked like this. |
| Line 2: | Line 2: |
| goto [:interact:interact main page] [[TableOfContents]] |
goto [[interact|interact main page]] <<TableOfContents>> |
| Line 43: | Line 43: |
| attachment:cobweb.png | {{attachment:cobweb.png}} |
| Line 85: | Line 85: |
| attachment:logisticorbits.png | {{attachment:logisticorbits.png}} |
Sage Interactions - Dynamical Systems
goto interact main page
Contents
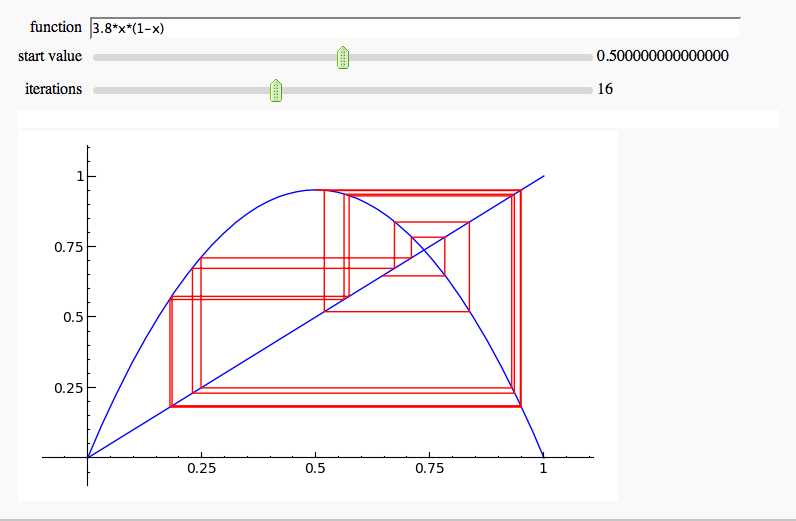
Cobweb diagrams on [0,1]
by Marshall Hampton.
def cobweb(a_function, start, mask = 0, iterations = 20, xmin = 0, xmax = 1):
    '''
    Returns a graphics object of a plot of the function and a cobweb trajectory starting from the value start.

    INPUT:
        a_function: a function of one variable
        start: the starting value of the iteration
        mask: (optional) the number of initial iterates to ignore
        iterations: (optional) the number of iterations to draw, following the masked iterations
        xmin: (optional) the lower end of the plotted interval
        xmax: (optional) the upper end of the plotted interval

    EXAMPLES:
        sage: f = lambda x: 3.9*x*(1-x)
        sage: show(cobweb(f,.01,iterations=200), xmin = 0, xmax = 1, ymin=0)

    '''
    basic_plot = plot(a_function, xmin = xmin, xmax = xmax)
    id_plot = plot(lambda x: x, xmin = xmin, xmax = xmax)
    iter_list = []
    current = start
    for i in range(mask):
        current = a_function(current)
    for i in range(iterations):
        iter_list.append([current,a_function(current)])
        current = a_function(current)
        iter_list.append([current,current])
    cobweb = line(iter_list, rgbcolor = (1,0,0))
    return basic_plot + id_plot + cobweb
var('x')
@interact
def cobwebber(f_text = input_box(default = "3.8*x*(1-x)",label = "function", type=str), start_val = slider(0,1,.01,.5,label = 'start value'), its = slider([2^i for i in range(0,12)],default = 16, label="iterations")):
    def f(x):
        return eval(f_text)
    show(cobweb(f, start_val, iterations = its))
Cythonized Logistic Orbit Map
By Marshall Hampton
%cython
cpdef double logorb(double k,long N,double x0):
    cdef double x = x0
    cdef long i
    for i from 1 <= i <= N:
        x = k*x*(1-x)
    return x

cpdef logtraj(double k,long N, double x0):
    cdef double x = x0
    xvals = []
    cdef long i
    for i from 1 <= i <= N:
        x = k*x*(1-x)
        xvals.append(x)
    return xvals
html('<h2>Orbit diagram of the logistic map</h2>')
@interact
def logistic_bifs(k_min = slider(0.0,4.0,.001,3.5), k_max = slider(0.0,4.0,.001,4.0)):
tkmax = max(k_min, k_max)
tkmin = min(k_min, k_max)
dk = (tkmax - tkmin)/1000.0
xpts = []
x = .5
for k in srange(tkmin,tkmax,dk):
x = logorb(k,100,x)
ks = logtraj(k,12,x)
if max(ks)-min(ks) < .001:
xpts.append([k,x])
else:
x = logorb(k,1000,x)
ks = logtraj(k,100,x)
xpts = xpts + [[k,q] for q in ks]
show(points(xpts, pointsize = 1), figsize = [6,6])
