|
Size: 2810
Comment:
|
Size: 2819
Comment: converted to 1.6 markup
|
| Deletions are marked like this. | Additions are marked like this. |
| Line 2: | Line 2: |
| goto [:interact:interact main page] | goto [[interact|interact main page]] |
| Line 4: | Line 4: |
| [[TableOfContents]] | <<TableOfContents>> |
| Line 21: | Line 21: |
| attachment:biobrowse.png | {{attachment:biobrowse.png}} |
| Line 71: | Line 71: |
| attachment:coalescent.png | {{attachment:coalescent.png}} |
Sage Interactions - Bioinformatics
goto interact main page
Web app: protein browser
by Marshall Hampton (tested by William Stein)
import urllib2 as U
@interact
def protein_browser(GenBank_ID = input_box('165940577', type = str), file_type = selector([(1,'fasta'),(2,'GenPept')])):
    if file_type == 2:
        gen_str = 'http://www.ncbi.nlm.nih.gov/entrez/viewer.fcgi?db=protein&sendto=t&id='
    else:
        gen_str = 'http://www.ncbi.nlm.nih.gov/entrez/viewer.fcgi?db=protein&sendto=t&dopt=fasta&id='
    f = U.urlopen(gen_str + GenBank_ID)
    g = f.read()
    f.close()
    html(g)
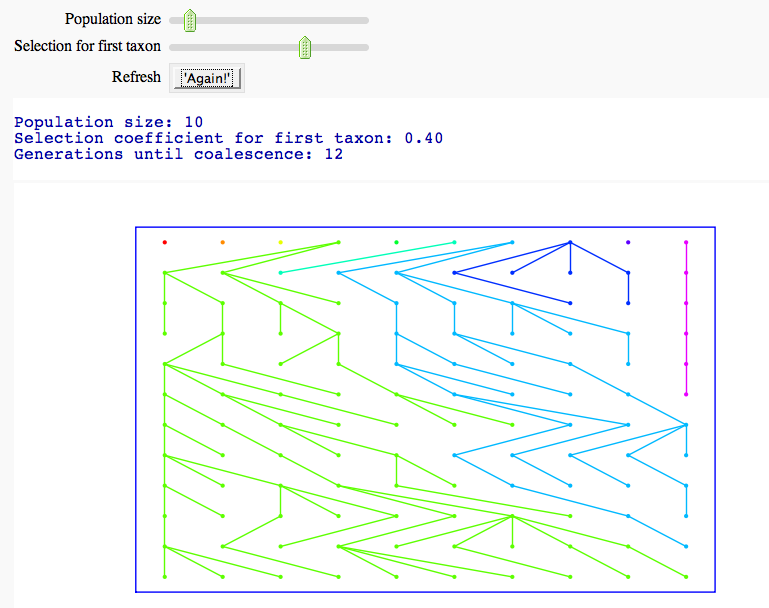
Coalescent simulator
by Marshall Hampton
def next_gen(x, selection=1.0):
    '''Creates the next generation from the previous; also returns parent-child indexing list'''
    next_x = []
    for ind in range(len(x)):
        if random() < (1 + selection)/len(x):
            rind = 0
        else:
            rind = int(round(random()*(len(x)-1)+1/2))
        next_x.append((x[rind],rind))
    next_x.sort()
    return [[x[0] for x in next_x],[x[1] for x in next_x]]
def coal_plot(some_data):
    '''Creates a graphics object from coalescent data'''
    gens = some_data[0]
    inds = some_data[1]
    gen_lines = line([[0,0]])
    pts = Graphics()
    ngens = len(gens)
    gen_size = len(gens[0])
    for x in range(gen_size):
        pts += point((x,ngens-1), hue = gens[0][x]/float(gen_size*1.1))
    p_frame = line([[-.5,-.5],[-.5,ngens-.5], [gen_size-.5,ngens-.5], [gen_size-.5,-.5], [-.5,-.5]])
    for g in range(1,ngens):
        for x in range(gen_size):
            old_x = inds[g-1][x]
            gen_lines += line([[x,ngens-g-1],[old_x,ngens-g]], hue = gens[g-1][old_x]/float(gen_size*1.1))
            pts += point((x,ngens-g-1), hue = gens[g][x]/float(gen_size*1.1))
    return pts+gen_lines+p_frame
d_field = RealField(10)
@interact
def coalescents(pop_size = slider(2,100,1,15,'Population size'), selection = slider(-1,1,.1,0, 'Selection for first taxon'), s = selector(['Again!'], label='Refresh', buttons=True)):
    print 'Population size: ' + str(pop_size)
    print 'Selection coefficient for first taxon: ' + str(d_field(selection))
    start = [i for i in range(pop_size)]
    gens = [start]
    inds = []
    while gens[-1][0] != gens[-1][-1]:
        g_index = len(gens) - 1
        n_gen = next_gen(gens[g_index], selection = selection)
        gens.append(n_gen[0])
        inds.append(n_gen[1])
        coal_data1 = [gens,inds]
    print 'Generations until coalescence: ' + str(len(gens))
    show(coal_plot(coal_data1), axes = False, figsize = [8,4.0*len(gens)/pop_size], ymax = len(gens)-1)
