|
Size: 8147
Comment:
|
← Revision 15 as of 2019-04-06 06:18:49 ⇥
Size: 7597
Comment: py3 print
|
| Deletions are marked like this. | Additions are marked like this. |
| Line 2: | Line 2: |
| goto [:interact:interact main page] | goto [[interact|interact main page]] |
| Line 4: | Line 4: |
| === Groebner fan of an ideal === | <<TableOfContents>> == Groebner fan of an ideal == |
| Line 6: | Line 8: |
| {{{ | {{{#!sagecell |
| Line 16: | Line 18: |
| attachment:gfan_interact.png == Number Theory == |
{{attachment:gfan_interact.png}} |
| Line 19: | Line 20: |
| === Factor Trees === by William Stein {{{ import random def ftree(rows, v, i, F): if len(v) > 0: # add a row to g at the ith level. rows.append(v) w = [] for i in range(len(v)): k, _, _ = v[i] if k is None or is_prime(k): w.append((None,None,None)) else: d = random.choice(divisors(k)[1:-1]) w.append((d,k,i)) e = k//d if e == 1: w.append((None,None)) else: w.append((e,k,i)) if len(w) > len(v): ftree(rows, w, i+1, F) def draw_ftree(rows,font): g = Graphics() for i in range(len(rows)): cur = rows[i] for j in range(len(cur)): e, f, k = cur[j] if not e is None: if is_prime(e): c = (1,0,0) else: c = (0,0,.4) g += text(str(e), (j*2-len(cur),-i), fontsize=font, rgbcolor=c) if not k is None and not f is None: g += line([(j*2-len(cur),-i), ((k*2)-len(rows[i-1]),-i+1)], alpha=0.5) return g |
== 3D Groebner fan browser FIXME == by Marshall Hampton {{{#!sagecell def proj4_to_3(gfanobj, poly4): fpoints = poly4.vertices() tpoints = [gfanobj._embed_tetra(q) for q in fpoints] adj_data = poly4.vertex_adjacencies() edges = [] for adj in adj_data: for vert in adj[1]: if vert > adj[0]: edges.append([tpoints[adj[0]],tpoints[vert]]) return edges, tpoints |
| Line 58: | Line 34: |
| from sage.plot.plot3d.index_face_set import IndexFaceSet def render_solid(poly, color = 'blue', opacity = .5): tri_faces = poly.triangulated_facial_incidences() from sage.plot.plot3d.index_face_set import IndexFaceSet return IndexFaceSet([q[1] for q in tri_faces], poly.vertices(), enclosed = True, color = color, opacity = opacity) def render3d(a_gf, color_fan = True, verbose = False, highlights = 'all'): g_cones = [q.groebner_cone() for q in a_gf.reduced_groebner_bases()] g_cones_facets = [q.facets() for q in g_cones] g_cones_ieqs = [a_gf._cone_to_ieq(q) for q in g_cones_facets] # Now the cones are intersected with a plane: cone_info = [ieq_to_vert(q,linearities=[[1,-1,-1,-1,-1]]) for q in g_cones_ieqs] if verbose: for x in cone_info: print(x.ieqs() + [[1,1,0,0,0],[1,0,1,0,0],[1,0,0,1,0],[1,0,0,0,1]]) print(x.linearities()) print("") cone_info = [Polyhedron(ieqs = x.ieqs() + [[1,1,0,0,0],[1,0,1,0,0],[1,0,0,1,0],[1,0,0,0,1]], linearities = x.linearities()) for x in cone_info] if color_fan == True: #using fixed color scheme color_list = [] our_vars = list(a_gf.ring().gens()) degs = [[max(q.degree(avar) for q in b) for avar in our_vars] for b in a_gf.reduced_groebner_bases()] maxdegs = [max(float(q[i]) for q in degs) for i in range(len(our_vars))] color_list = [[b[0]/maxdegs[0],b[1]/maxdegs[1],(b[2]+b[3])/(maxdegs[2]+maxdegs[3])] for b in degs] color_list = [tuple(c[i]/max(c) for i in range(3)) for c in color_list] faces = [] if highlights == 'all': highlights = range(len(cone_info)) all_lines = [] i = 0 for cone_data in cone_info: # cone_data is a Polyhedron. try: pdata = proj4_to_3(a_gf,cone_data) cone_lines = pdata[0] cone_verts = pdata[1] if color_fan == True: if i in highlights: faces.append(render_solid(Polyhedron(vertices = cone_verts), color = color_list[i])) i = i + 1 except: print(cone_data._rays) raise RuntimeError for a_line in cone_lines: all_lines.append(a_line) if faces == []: faceadds = Graphics() else: faceadds = sum(faces) return sum([line3d(a_line) for a_line in all_lines]) + faceadds R4.<w,x,y,z> = PolynomialRing(QQ,4) temp_id = R4.ideal([w^3-x^2, x^3-y^21, y^3-w^2, z - x^2]) temp_gf4 = temp_id.groebner_fan() temp_gf4_rbs = temp_gf4.reduced_groebner_bases() gbdict = dict([['w^3-x^2, x^3-y^2, y^3-w^2, z - x^2',(temp_gf4,temp_gf4_rbs)]]) |
|
| Line 59: | Line 94: |
| def factor_tree(n=100, font=(10, (8..20)), redraw=['Redraw']): n = Integer(n) rows = [] v = [(n,None,0)] ftree(rows, v, 0, factor(n)) show(draw_ftree(rows, font), axes=False) |
def Groebner_fan_browser(bsel = slider(0,100,.1,0,label='Individual basis selection', display_value = False), ideal_gens = input_box(default = 'w^3-x^2, x^3-y^2, y^3-w^2, z - x^2', type = str, label = "Ideal generators"), showall = checkbox(True, "Show me them all"), showbases = checkbox(False, "Show highlighted basis")): html('<h3>Groebner fan 3D browser</h3> Enter 4 polynomials in the variables w,x,y,z<BR> <em>This may take forever if you are overambitious</em>') R4.<w,x,y,z> = PolynomialRing(QQ,4) if ideal_gens not in gbdict: id_gens = R4.ideal(list(ideal_gens.split(','))) print(id_gens) gf4 = id_gens.groebner_fan() gf4rbs = gf4.reduced_groebner_bases() gbdict[ideal_gens] = (gf4,gf4rbs) else: gf4 = gbdict[ideal_gens][0] gf4rbs = gbdict[ideal_gens][1] bnumbers = len(gf4rbs) b_select = [int(bsel*bnumbers/100.0)] if showall: b_select = range(bnumbers) if showbases: for b in b_select: show(gf4rbs[b]) show(render3d(gf4, highlights = b_select), frame = False) |
| Line 66: | Line 114: |
| attachment:factortree.png | {{attachment:gb3d.png}} |
| Line 68: | Line 116: |
| === Continued Fraction Plotter === by William Stein {{{ |
== Numerical Solutions of Polynomial Systems with PHCpack FIXME == by Marshall Hampton; requires phcpack optional package (PHCpack written by Jan Verschelde). The example below is a two-parameter deformation of the cyclic-6 problem. Solution paths are tracked through the parameter homotopy. {{{#!sagecell from sage.interfaces.phc import phc zringA.<z0,z1,z2,z3,z4,z5,a,b> = PolynomialRing(QQ,8) cyclic6 = [z0 + z1 + z2 + z3 + z4 + z5+a, z0*z1 + z1*z2 + z2*z3 + z3*z4 + z4*z5 + z5*z0, z0*z1*z2 + z1*z2*z3 + z2*z3*z4 + z3*z4*z5 + z4*z5*z0 + z5*z0*z1, z0*z1*z2*z3 + z1*z2*z3*z4 + z2*z3*z4*z5 + z3*z4*z5*z0 + z4*z5*z0*z1 + z5*z0*z1*z2, z0*z1*z2*z3*z4 + z1*z2*z3*z4*z5 + z2*z3*z4*z5*z0 + z3*z4*z5*z0*z1 + z4*z5*z0*z1*z2 + z5*z0*z1*z2*z3, z0*z1*z2*z3*z4*z5 - b] zring.<z0,z1,z2,z3,z4,z5> = PolynomialRing(QQ,6) z1 = [zring(x.subs({a:1/10, b:1/10})) for x in cyclic6] s1 = phc.blackbox(z1,zring) s1sas = s1.save_as_start(start_filename = DATA + 's1phc') cstate = [open(DATA + 's1phc').read()] def def_cyclic(ain, bin): eqs = [zring(x.subs({a:ain, b:bin})) for x in cyclic6] return eqs slines2d = [] mpts = [] |
| Line 72: | Line 141: |
| def _(number=e, ymax=selector([None,5,20,..,400],nrows=2), clr=Color('purple'), prec=[500,1000,..,5000]): c = list(continued_fraction(RealField(prec)(number))); print c show(line([(i,z) for i, z in enumerate(c)],rgbcolor=clr),ymax=ymax,figsize=[10,2]) |
def tbp_tracker(show_eqs = checkbox(False),a = slider(-1,1,1/100,1/100), b = slider(-1,1,1/100,1/100), h_c_skew = slider(0,.1,.001,0.0, label='Homotopy skew'), scale = slider([2.0^x for x in srange(.1,4,.025)],default = 2^1.6)): z_pt = phc._path_track_file(start_filename_or_string = cstate[-1], polys = def_cyclic(a,b), input_ring = zring, c_skew = h_c_skew) cstate.append(open(z_pt).read()) z_pp = phc._parse_path_file(z_pt) hue_v = len(cstate)/(len(cstate)+1) znames = ['z0','z1','z2','z3','z4','z5'] for a_sol in z_pp: for z in znames: mpts.append(point([a_sol[0][z].real(), a_sol[0][z].imag()], hue=hue_v,pointsize=3)) mpts.append(point([a_sol[-1][z].real(), a_sol[-1][z].imag()], hue=hue_v,pointsize=3)) for a_sol in z_pp: zlines = [[] for q in znames] for data in a_sol: for i in range(len(znames)): zn = znames[i] zlines[i].append([data[zn].real(), data[zn].imag()]) for zl in zlines: slines2d.append(line(zl, thickness = .5)) show(sum(slines2d)+sum(mpts), figsize = [5,5], xmin = -scale, xmax=scale, ymin=-scale,ymax=scale, axes = false) if show_eqs: pols = def_cyclic(a,b) for i in range(len(pols)): show(pols[i]) |
| Line 76: | Line 165: |
| attachment:contfracplot.png === Illustrating the prime number thoerem === by William Stein {{{ @interact def _(N=(100,(2..2000))): html("<font color='red'>$\pi(x)$</font> and <font color='blue'>$x/(\log(x)-1)$</font> for $x < %s$"%N) show(plot(prime_pi, 0, N, rgbcolor='red') + plot(x/(log(x)-1), 5, N, rgbcolor='blue')) }}} attachment:primes.png === Computing Generalized Bernoulli Numbers === by William Stein (Sage-2.10.3) {{{ @interact def _(m=selector([1..15],nrows=2), n=(7,(3..10))): G = DirichletGroup(m) s = "<h3>First n=%s Bernoulli numbers attached to characters with modulus m=%s</h3>"%(n,m) s += '<table border=1>' s += '<tr bgcolor="#edcc9c"><td align=center>$\\chi$</td><td>Conductor</td>' + \ ''.join('<td>$B_{%s,\chi}$</td>'%k for k in [1..n]) + '</tr>' for eps in G.list(): v = ''.join(['<td align=center bgcolor="#efe5cd">$%s$</td>'%latex(eps.bernoulli(k)) for k in [1..n]]) s += '<tr><td bgcolor="#edcc9c">%s</td><td bgcolor="#efe5cd" align=center>%s</td>%s</tr>\n'%( eps, eps.conductor(), v) s += '</table>' html(s) }}} attachment:bernoulli.png === Fundamental Domains of SL_2(ZZ) === by Robert Miller {{{ L = [[-0.5, 2.0^(x/100.0) - 1 + sqrt(3.0)/2] for x in xrange(1000, -1, -1)] R = [[0.5, 2.0^(x/100.0) - 1 + sqrt(3.0)/2] for x in xrange(1000)] xes = [x/1000.0 for x in xrange(-500,501,1)] M = [[x,abs(sqrt(x^2-1))] for x in xes] fundamental_domain = L+M+R fundamental_domain = [[x-1,y] for x,y in fundamental_domain] @interact def _(gen = selector(['t+1', 't-1', '-1/t'], nrows=1)): global fundamental_domain if gen == 't+1': fundamental_domain = [[x+1,y] for x,y in fundamental_domain] elif gen == 't-1': fundamental_domain = [[x-1,y] for x,y in fundamental_domain] elif gen == '-1/t': new_dom = [] for x,y in fundamental_domain: sq_mod = x^2 + y^2 new_dom.append([(-1)*x/sq_mod, y/sq_mod]) fundamental_domain = new_dom P = polygon(fundamental_domain) P.ymax(1.2); P.ymin(-0.1) P.show() }}} attachment:fund_domain.png === Computing modular forms === by William Stein {{{ j = 0 @interact def _(N=[1..100], k=selector([2,4,..,12],nrows=1), prec=(3..40), group=[(Gamma0, 'Gamma0'), (Gamma1, 'Gamma1')]): M = CuspForms(group(N),k) print j; global j; j += 1 print M; print '\n'*3 print "Computing basis...\n\n" if M.dimension() == 0: print "Space has dimension 0" else: prec = max(prec, M.dimension()+1) for f in M.basis(): view(f.q_expansion(prec)) print "\n\n\nDone computing basis." }}} attachment:modformbasis.png === Computing the cuspidal subgroup === by William Stein {{{ html('<h1>Cuspidal Subgroups of Modular Jacobians J0(N)</h1>') @interact def _(N=selector([1..8*13], ncols=8, width=10, default=10)): A = J0(N) print A.cuspidal_subgroup() }}} attachment:cuspgroup.png === A Charpoly and Hecke Operator Graph === by William Stein {{{ # Note -- in Sage-2.10.3; multiedges are missing in plots; loops are missing in 3d plots @interact def f(N = prime_range(11,400), p = selector(prime_range(2,12),nrows=1), three_d = ("Three Dimensional", False)): S = SupersingularModule(N) T = S.hecke_matrix(p) G = Graph(T, multiedges=True, loops=not three_d) html("<h1>Charpoly and Hecke Graph: Level %s, T_%s</h1>"%(N,p)) show(T.charpoly().factor()) if three_d: show(G.plot3d(), aspect_ratio=[1,1,1]) else: show(G.plot(),figsize=7) }}} attachment:heckegraph.png === Demonstrating the Diffie-Hellman Key Exchange Protocol === by Timothy Clemans (refereed by William Stein) {{{ @interact def diffie_hellman(button=selector(["New example"],label='',buttons=True), bits=("Number of bits of prime", (8,12,..512))): maxp = 2^bits p = random_prime(maxp) k = GF(p) if bits>100: g = k(2) else: g = k.multiplicative_generator() a = ZZ.random_element(10, maxp) b = ZZ.random_element(10, maxp) print """ <html> <style> .gamodp { background:yellow } .gbmodp { background:orange } .dhsame { color:green; font-weight:bold } </style> <h2>%s-Bit Diffie-Hellman Key Exchange</h2> <ol style="color:#000;font:12px Arial, Helvetica, sans-serif"> <li>Alice and Bob agree to use the prime number p=%s and base g=%s.</li> <li>Alice chooses the secret integer a=%s, then sends Bob (<span class="gamodp">g<sup>a</sup> mod p</span>):<br/>%s<sup>%s</sup> mod %s = <span class="gamodp">%s</span>.</li> <li>Bob chooses the secret integer b=%s, then sends Alice (<span class="gbmodp">g<sup>b</sup> mod p</span>):<br/>%s<sup>%s</sup> mod %s = <span class="gbmodp">%s</span>.</li> <li>Alice computes (<span class="gbmodp">g<sup>b</sup> mod p</span>)<sup>a</sup> mod p:<br/>%s<sup>%s</sup> mod %s = <span class="dhsame">%s</span>.</li> <li>Bob computes (<span class="gamodp">g<sup>a</sup> mod p</span>)<sup>b</sup> mod p:<br/>%s<sup>%s</sup> mod %s = <span class="dhsame">%s</span>.</li> </ol></html> """ % (bits, p, g, a, g, a, p, (g^a), b, g, b, p, (g^b), (g^b), a, p, (g^ b)^a, g^a, b, p, (g^a)^b) }}} attachment:dh.png === Plotting an elliptic curve over a finite field === {{{ E = EllipticCurve('37a') @interact def _(p=slider(prime_range(1000), default=389)): show(E) print "p = %s"%p show(E.change_ring(GF(p)).plot(),xmin=0,ymin=0) }}} attachment:ellffplot.png |
{{attachment:pathtrack.png}} |
Sage Interactions - Algebra
goto interact main page
Contents
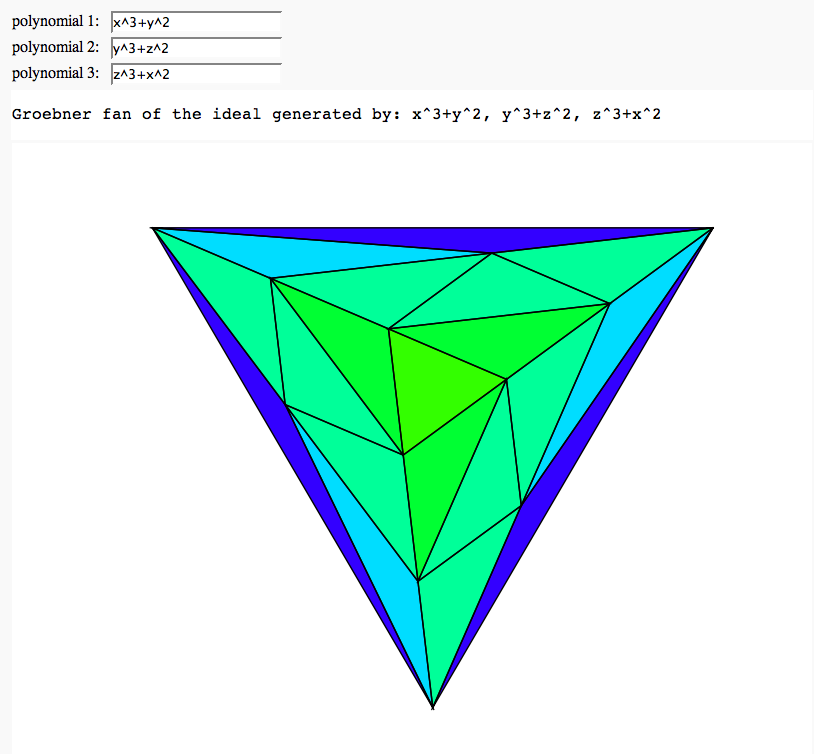
Groebner fan of an ideal
by Marshall Hampton; (needs sage-2.11 or higher, with gfan-0.3 interface)

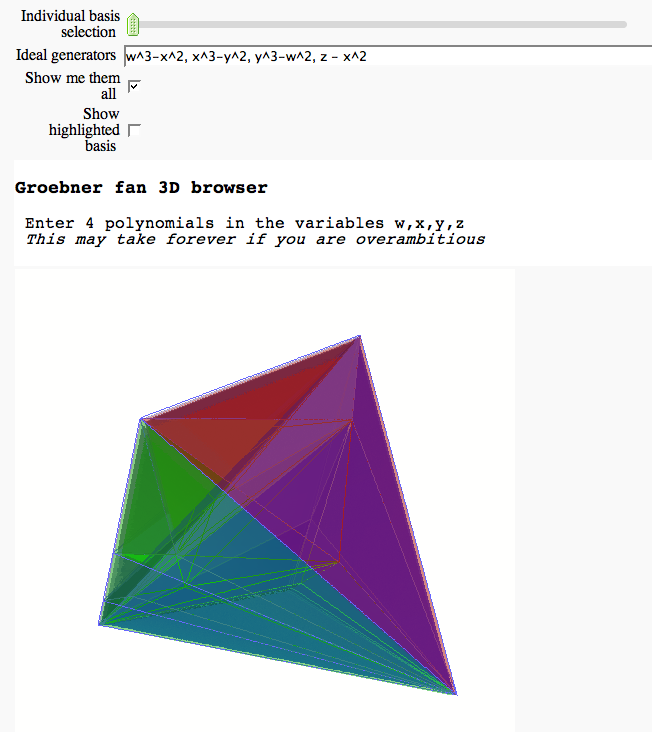
3D Groebner fan browser FIXME
by Marshall Hampton

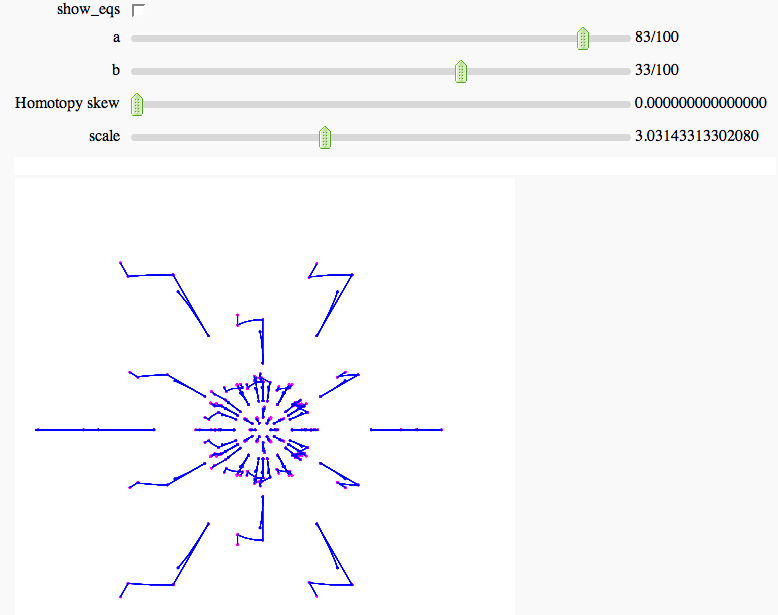
Numerical Solutions of Polynomial Systems with PHCpack FIXME
by Marshall Hampton; requires phcpack optional package (PHCpack written by Jan Verschelde). The example below is a two-parameter deformation of the cyclic-6 problem. Solution paths are tracked through the parameter homotopy.

