|
Size: 9930
Comment:
|
← Revision 28 as of 2008-11-14 13:41:50 ⇥
Size: 12645
Comment: converted to 1.6 markup
|
| Deletions are marked like this. | Additions are marked like this. |
| Line 1: | Line 1: |
| Emily Kirkman is working on this project. [http://sage.math.washington.edu:9001/graph Back to main wiki.] | The Cayley graph for $A_5$: {{{ sage: G = sage.groups.perm_gps.permgroup.AlternatingGroup(5) sage: C = G.cayley_graph() sage: C.show3d(bgcolor=(0,0,0), arc_color=(1,1,1), vertex_size=0.02, arc_size=0.007, arc_size2=0.01, xres=1000, yres=800, iterations=200) }}} {{attachment:A5.jpg}} Emily Kirkman and Robert Miller are working on this project. [[http://wiki.sagemath.org/graph|Back to main wiki.]] |
| Line 9: | Line 19: |
| Due to the volume of graphs now in the generators class, this wiki page is now intended to give status updates and serve as a gallery of graphs currently implemented. To see information on a specific graph, run SAGE or the SAGE [http://sage.math.washington.edu:8100 notebook]. For a list of graph constructors, type "graphs." and hit tab. For docstrings, type the graph name and one question mark (i.e.: "graphs.!CubeGraph?") then shift + enter. For source code, do likewise with two question marks. [[TableOfContents]] |
Due to the volume of graphs now in the generators class, this wiki page is now intended to give status updates and serve as a gallery of graphs currently implemented. To see information on a specific graph, run SAGE or the SAGE [[http://sage.math.washington.edu:8100|notebook]]. For a list of graph constructors, type "graphs." and hit tab. For docstrings, type the graph name and one question mark (i.e.: "graphs.!CubeGraph?") then shift + enter. For source code, do likewise with two question marks. <<TableOfContents>> |
| Line 49: | Line 59: |
}}} attachment:chvatal.png |
sage: (graphs.ChvatalGraph()).show(figsize=[4,4], graph_border=True) }}} {{attachment:chvatal.png}} |
| Line 55: | Line 65: |
}}} attachment:desargues.png |
sage: (graphs.DesarguesGraph()).show(figsize=[4,4], graph_border=True) }}} {{attachment:desargues.png}} |
| Line 65: | Line 75: |
| attachment:flower.png | {{attachment:flower.png}} |
| Line 72: | Line 82: |
| attachment:frucht.png | {{attachment:frucht.png}} |
| Line 79: | Line 89: |
| attachment:heawood.png | {{attachment:heawood.png}} |
| Line 86: | Line 96: |
| attachment:moebiuskantor.png | {{attachment:moebiuskantor.png}} |
| Line 90: | Line 100: |
}}} attachment:pappus.png |
sage: (graphs.PappusGraph()).show(figsize=[4,4], graph_border=True) }}} {{attachment:pappus.png}} |
| Line 99: | Line 109: |
| attachment:petersen.png | {{attachment:petersen.png}} |
| Line 106: | Line 116: |
| attachment:thomsen.png | {{attachment:thomsen.png}} |
| Line 119: | Line 129: |
| attachment:compbip.png | {{attachment:compbip.png}} |
| Line 129: | Line 139: |
| attachment:complete.png | {{attachment:complete.png}} |
| Line 139: | Line 149: |
| attachment:cube.png | {{attachment:cube.png}} |
| Line 145: | Line 155: |
| attachment:biggercube.png | {{attachment:biggercube.png}} |
| Line 149: | Line 159: |
}}} attachment:baltree.png |
sage: (graphs.BalancedTree(3,5)).show(node_size=20, vertex_labels=False, figsize=[4,4], graph_border=True) }}} {{attachment:baltree.png}} |
| Line 155: | Line 165: |
}}} attachment:lcf.png |
sage: (graphs.LCFGraph(20, [-10,-7,-5,4,7,-10,-7,-4,5,7,-10,-7,6,-5,7,-10,-7,5,-6,7], 1)).show(figsize=[4,4], graph_border=True) }}} {{attachment:lcf.png}} |
| Line 166: | Line 176: |
| attachment:tetrahedral.png | {{attachment:tetrahedral.png}} |
| Line 170: | Line 180: |
}}} attachment:hexahedral.png |
sage: (graphs.HexahedralGraph()).show(figsize=[4,4], graph_border=True) }}} {{attachment:hexahedral.png}} |
| Line 179: | Line 189: |
| attachment:octahedral.png | {{attachment:octahedral.png}} |
| Line 183: | Line 193: |
}}} attachment:icosahedral.png |
sage: (graphs.IcosahedralGraph()).show(figsize=[4,4], graph_border=True) }}} {{attachment:icosahedral.png}} |
| Line 192: | Line 202: |
| attachment:dodecahedral.png | {{attachment:dodecahedral.png}} |
| Line 198: | Line 208: |
}}} attachment:dorogovtsev.png |
sage: (graphs.DorogovtsevGoltsevMendesGraph(5)).show(figsize=[4,4], graph_border=True, vertex_size=10, vertex_labels=False) }}} {{attachment:tmp_6.png}} |
| Line 213: | Line 223: |
| attachment:barbell.png | {{attachment:barbell.png}} |
| Line 220: | Line 230: |
| attachment:bull.png | {{attachment:bull.png}} |
| Line 227: | Line 237: |
| attachment:circladder.png | {{attachment:circladder.png}} |
| Line 234: | Line 244: |
| attachment:claw.png | {{attachment:claw.png}} |
| Line 241: | Line 251: |
| attachment:cycle.png | {{attachment:cycle.png}} |
| Line 248: | Line 258: |
| attachment:diamond.png | {{attachment:diamond.png}} |
| Line 255: | Line 265: |
| attachment:empty.png | {{attachment:empty.png}} |
| Line 262: | Line 272: |
| attachment:grid.png | {{attachment:grid.png}} |
| Line 269: | Line 279: |
| attachment:house.png | {{attachment:house.png}} |
| Line 276: | Line 286: |
| attachment:housex.png | {{attachment:housex.png}} |
| Line 283: | Line 293: |
| attachment:krack.png | {{attachment:krack.png}} |
| Line 290: | Line 300: |
| attachment:ladder.png | {{attachment:ladder.png}} |
| Line 301: | Line 311: |
| attachment:lollipop.png | {{attachment:lollipop.png}} |
| Line 311: | Line 321: |
| attachment:path.png | {{attachment:path.png}} |
| Line 321: | Line 331: |
| attachment:star.png | {{attachment:star.png}} |
| Line 331: | Line 341: |
| attachment:wheel.png | {{attachment:wheel.png}} |
| Line 343: | Line 353: |
| attachment:random.png | {{attachment:random.png}} |
| Line 353: | Line 363: |
| attachment:randomfast.png | {{attachment:randomfast.png}} |
| Line 357: | Line 367: |
}}} attachment:barabasi.png |
sage: (graphs.RandomBarabasiAlbert(7,3)).show(figsize=[4,4], graph_border=True) }}} {{attachment:barabasi.png}} |
| Line 363: | Line 373: |
}}} attachment:gnm.png |
sage: (graphs.RandomGNM(7,16)).show(figsize=[4,4], graph_border=True) }}} {{attachment:gnm.png}} |
| Line 369: | Line 379: |
}}} attachment:newman.png |
sage: (graphs.RandomNewmanWattsStrogatz(7,3,.5)).show(figsize=[4,4], graph_border=True) }}} {{attachment:newman.png}} |
| Line 375: | Line 385: |
}}} attachment:holme.png |
sage: (graphs.RandomHolmeKim(12,3,.4)).show(figsize=[4,4], graph_border=True) }}} {{attachment:holme.png}} |
| Line 381: | Line 391: |
}}} attachment:lobster.png |
sage: (graphs.RandomHolmeKim(12,3,.4)).show(figsize=[4,4], graph_border=True) }}} {{attachment:lobster.png}} |
| Line 387: | Line 397: |
}}} attachment:powerlaw.png |
sage: (graphs.RandomTreePowerlaw(15)).show(figsize=[4,4], graph_border=True) }}} {{attachment:powerlaw.png}} |
| Line 393: | Line 403: |
}}} attachment:randreg.png |
sage: (graphs.RandomRegular(3,20)).show(node_size=20, vertex_labels=False, figsize=[4,4], graph_border=True) }}} {{attachment:randreg.png}} |
| Line 399: | Line 409: |
}}} attachment:shell.png |
sage: (graphs.RandomShell([(10,20,0.8),(20,40,0.8)])).show(node_size=20, vertex_labels=False, figsize=[4,4], graph_border=True) }}} {{attachment:shell.png}} |
| Line 404: | Line 414: |
| {{{ }}} attachment:randdir.png |
|
| Line 411: | Line 417: |
}}} attachment:randdirgn.png |
sage: (graphs.RandomDirectedGN(12)).show(node_size=20, vertex_labels=False, figsize=[4,4], graph_border=True) }}} {{attachment:randdirgn.png}} |
| Line 417: | Line 423: |
}}} attachment:randdirgnc.png |
sage: (graphs.RandomDirectedGNC(12)).show(node_size=20, vertex_labels=False, figsize=[4,4], graph_border=True) }}} {{attachment:randdirgnc.png}} |
| Line 423: | Line 429: |
}}} attachment:randdirgnr.png |
sage: (graphs.RandomDirectedGNR(12,.15)).show(node_size=20, vertex_labels=False, figsize=[4,4], graph_border=True) }}} {{attachment:randdirgnr.png}} |
| Line 431: | Line 437: |
}}} attachment:degseq.png |
sage: (graphs.DegreeSequence([3,3,3,3,3,3,3,3,3,3,3,3,3,3,3,3,3,3,3,3,3,3])).show(vertex_labels=False, node_size=30, figsize=[4,4], graph_border=True) }}} {{attachment:degseq.png}} |
| Line 437: | Line 443: |
}}} attachment:degseqconf.png |
sage: (graphs.DegreeSequenceConfigurationModel([3,3,3,3,3,3,3,3,3,3,3,3,3,3,3,3,3,3,3,3])).show(vertex_labels=False, node_size=30, figsize=[4,4], graph_border=True) }}} {{attachment:degseqconf.png}} |
| Line 443: | Line 449: |
}}} attachment:degseqtree.png |
sage: (graphs.DegreeSequenceTree([3,1,3,3,1,1,1,2,1])).show(figsize=[4,4], graph_border=True) }}} {{attachment:degseqtree.png}} |
| Line 449: | Line 455: |
}}} attachment:degseqexp.png |
sage: (graphs.DegreeSequenceExpected([1,2,3,2,3])).show(figsize=[4,4],graph_border=True) }}} {{attachment:degseqexp.png}} |
The Cayley graph for A_5:
sage: G = sage.groups.perm_gps.permgroup.AlternatingGroup(5)
sage: C = G.cayley_graph()
sage: C.show3d(bgcolor=(0,0,0), arc_color=(1,1,1), vertex_size=0.02, arc_size=0.007, arc_size2=0.01, xres=1000, yres=800, iterations=200)
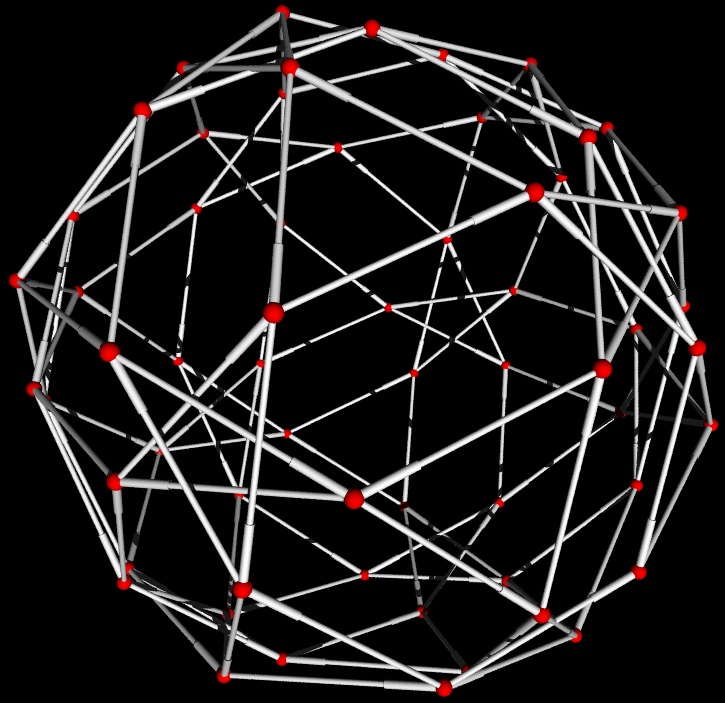
Emily Kirkman and Robert Miller are working on this project. Back to main wiki.
The goal of the Graph Generators Class is to implement constructors for many common graphs, as well as thorough docstrings that can be used for reference. The graph generators will grow as the Graph Theory Project does. So please check back for additions and feel free to leave requests in the suggestions section.
We currently have 54 constructors of named graphs and basic structures. Most of these graphs are constructed with a preset dictionary of x-y coordinates of each node. This is advantageous for both style and time. (The default graph plotting in SAGE uses the spring-layout algorithm). SAGE graphs all have an associated graphics object, and examples of plotting options are shown on the graphs below.
As we implement algorithms into the Graph Theory Package, the constructors of known graphs would set their properties upon instantiation as well. For example, if someone created a very large complete bipartite graph and then asked if it is a bipartite graph (not currently implemented), then instead of running through an algorithm to check it, we could return a value set at instantiation. Further, this will improve the reference use of the docstrings as we would list the properties of each named graph.
Due to the volume of graphs now in the generators class, this wiki page is now intended to give status updates and serve as a gallery of graphs currently implemented. To see information on a specific graph, run SAGE or the SAGE notebook. For a list of graph constructors, type "graphs." and hit tab. For docstrings, type the graph name and one question mark (i.e.: "graphs.CubeGraph?") then shift + enter. For source code, do likewise with two question marks.
Contents
Suggestions
- ???
Graphs I Plan to Add
Inherited from NetworkX
- Bipartite Generators
- Grid (n-dim)
- Sedgewick
- Truncated cube
- Truncated tetrahedron
- Tutte
Families of Graphs
- Generalized Petersen graphs
- Petersen Graph family
- Trees (Directed – not simple. Maybe Balanced tree constructor and query isTree)
- Cayley (Requires Edge Coloring)
- Paley
Named Graphs
- Brinkman
- Clebsch
- Grötzsch graph
- Tutte eight-cage
- Szekeres snark
- Thomassen graph
- Johnson (maybe own class)
- Turan
Gallery of Graph Generators in SAGE
Named Graphs
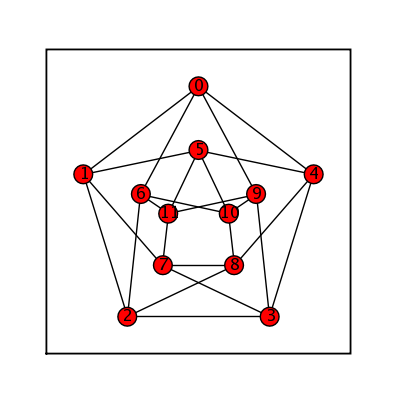
Chvatal Graph
sage: (graphs.ChvatalGraph()).show(figsize=[4,4], graph_border=True)
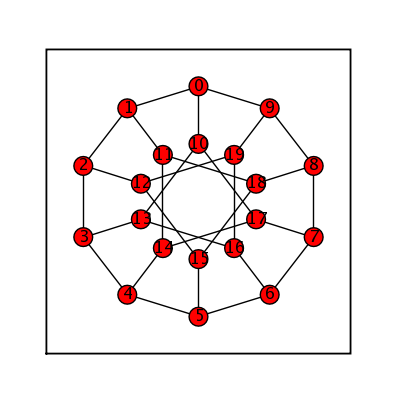
Desargues Graph
sage: (graphs.DesarguesGraph()).show(figsize=[4,4], graph_border=True)
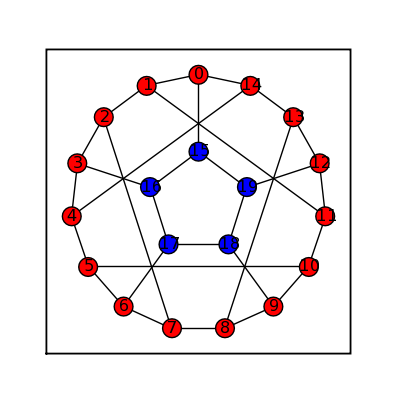
Flower Snark
sage: flower_snark = graphs.FlowerSnark()
sage: flower_snark.set_boundary([15,16,17,18,19])
sage: flower_snark.show(figsize=[4,4], graph_border=True)
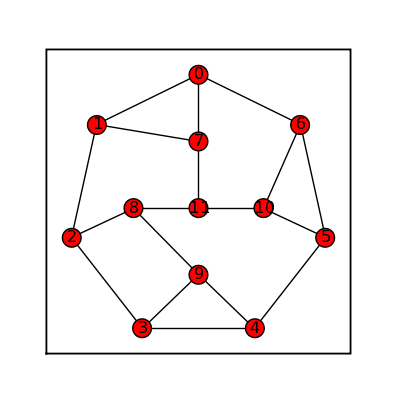
Frucht
sage: frucht = graphs.FruchtGraph()
sage: frucht.show(figsize=[4,4], graph_border=True)
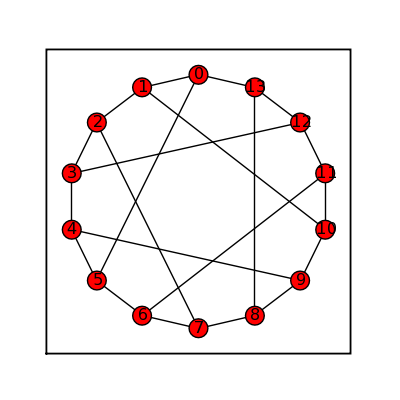
Heawood
sage: heawood = graphs.HeawoodGraph()
sage: heawood.show(figsize=[4,4], graph_border=True)
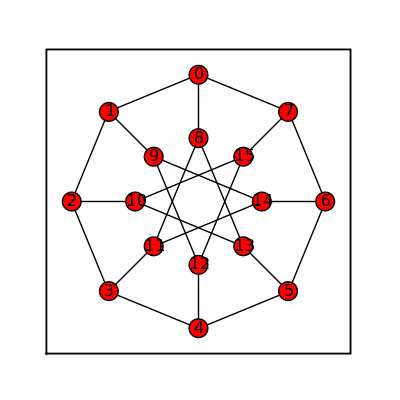
Möbius Kantor
sage: moebius_kantor = graphs.MoebiusKantorGraph()
sage: moebius_kantor.show(figsize=[4,4], graph_border=True)
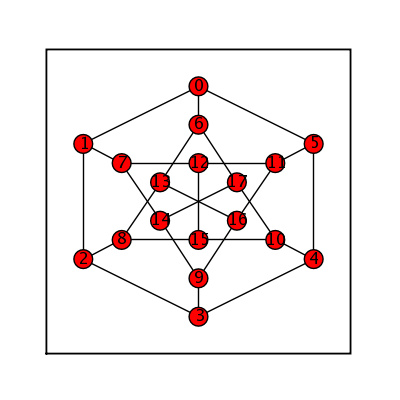
Pappus Graph
sage: (graphs.PappusGraph()).show(figsize=[4,4], graph_border=True)
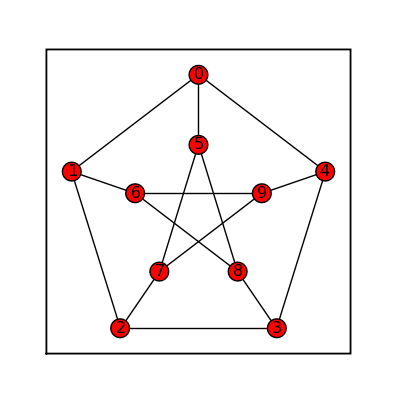
Petersen
sage: petersen = graphs.PetersenGraph()
sage: petersen.show(figsize=[4,4], graph_border=True)
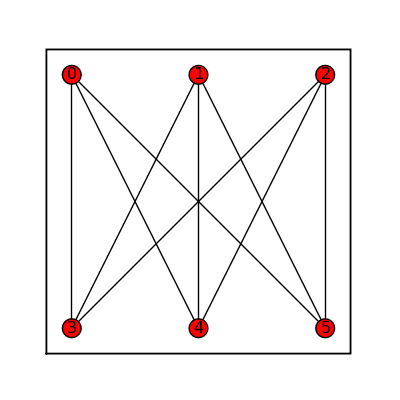
Thomsen
sage: thomsen = graphs.ThomsenGraph()
sage: thomsen.show(figsize=[4,4], graph_border=True)
Graph Families
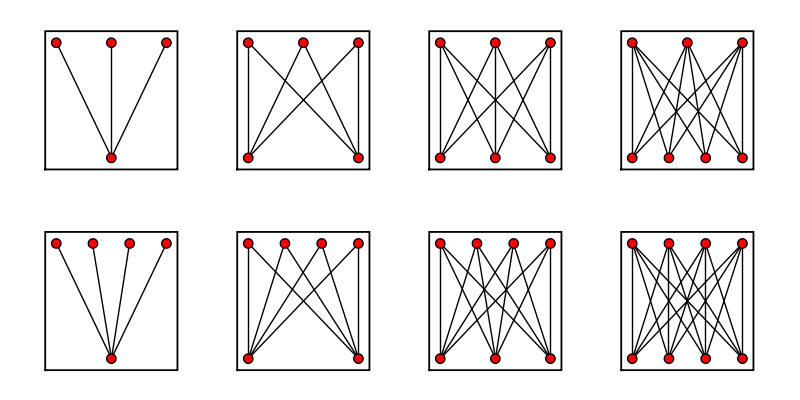
Complete Bipartite Graphs
sage: comp_bip_list = []
sage: for i in range (2):
... for j in range (4):
...  comp_bip_list.append(graphs.CompleteBipartiteGraph(i+3,j+1))
...
sage: graphs_list.show_graphs(comp_bip_list)
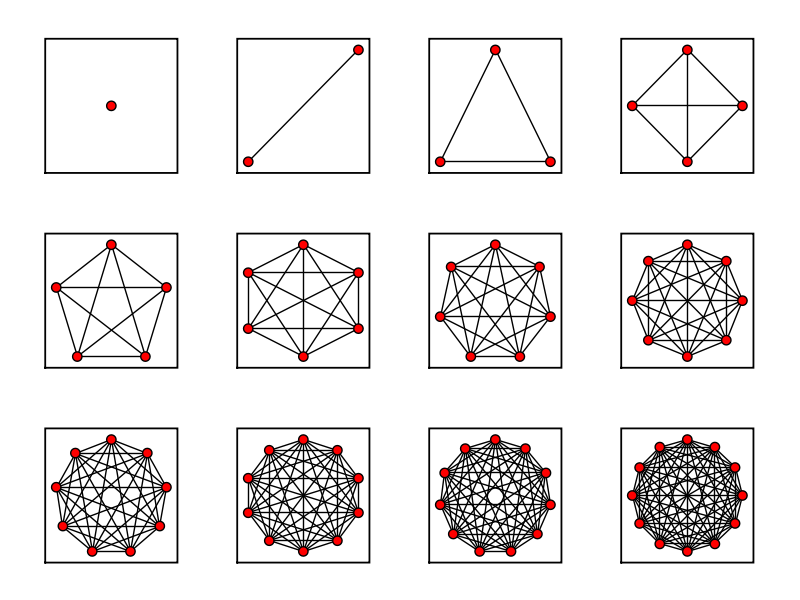
Complete Graphs
sage: comp_list = []
sage: for i in range(13)[1:]:
... comp_list.append(graphs.CompleteGraph(i))
...
sage: graphs_list.show_graphs(comp_list)
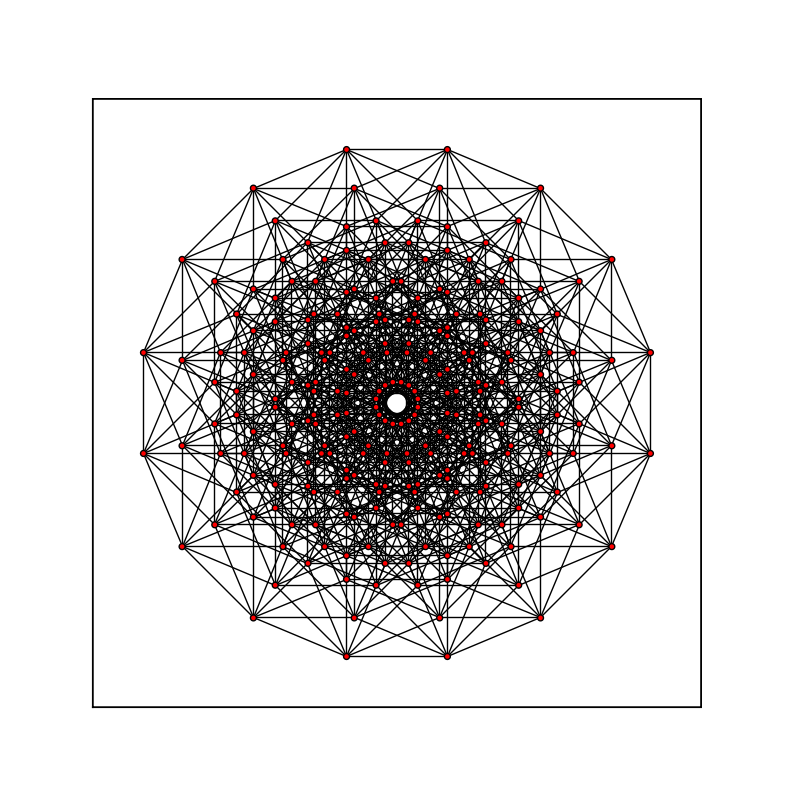
Cube Graphs
sage: cube_list = []
sage: for i in range(6)[2:]:
... cube_list.append(graphs.CubeGraph(i))
...
sage: graphs_list.show_graphs(cube_list)

sage: bigger_cube = graphs.CubeGraph(8)
sage: bigger_cube.show(figsize=[8,8], node_size=20, vertex_labels=False, graph_border=True)
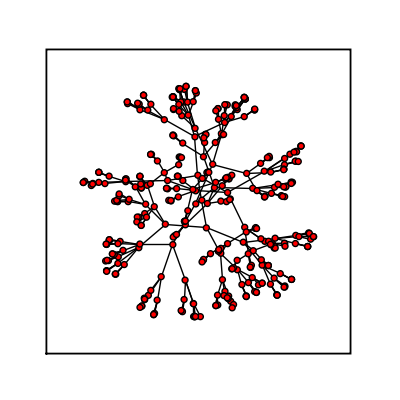
Balanced Tree
sage: (graphs.BalancedTree(3,5)).show(node_size=20, vertex_labels=False, figsize=[4,4], graph_border=True)
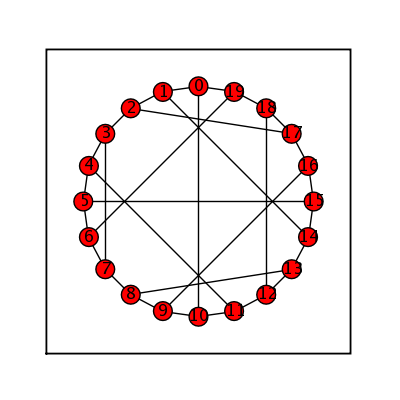
LCF Graph
sage: (graphs.LCFGraph(20, [-10,-7,-5,4,7,-10,-7,-4,5,7,-10,-7,6,-5,7,-10,-7,5,-6,7], 1)).show(figsize=[4,4], graph_border=True)
Platonic Solids
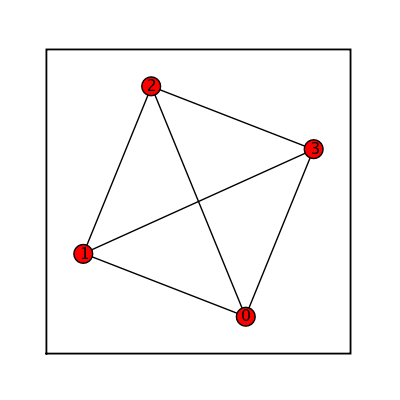
Tetrahedral Graph
sage: tetrahedral = graphs.TetrahedralGraph()
sage: tetrahedral.show(figsize=[4,4], graph_border=True)
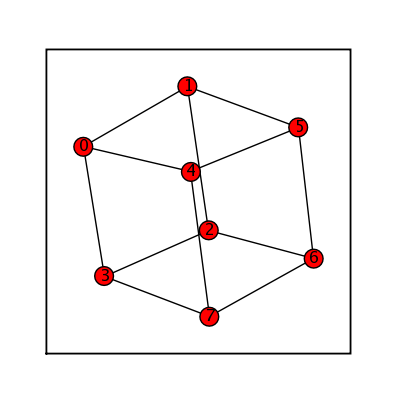
Hexahedral Graph
sage: (graphs.HexahedralGraph()).show(figsize=[4,4], graph_border=True)
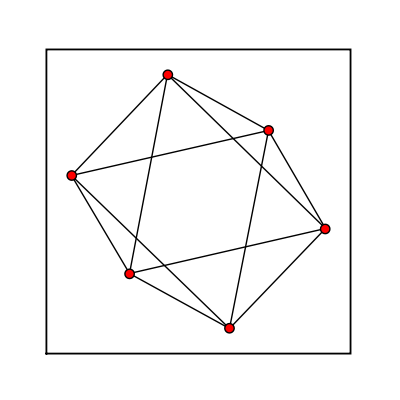
Octahedral Graph
sage: octahedral = graphs.OctahedralGraph()
sage: octahedral.show(figsize=[4,4], vertex_labels=False, node_size=50, graph_border=True)
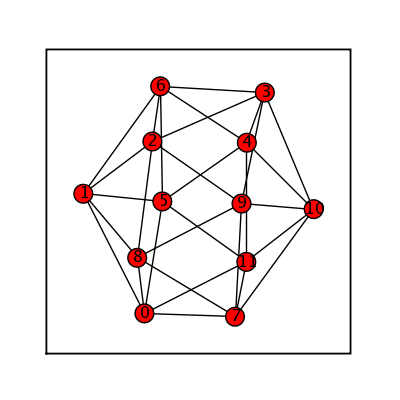
Icosahedral Graph
sage: (graphs.IcosahedralGraph()).show(figsize=[4,4], graph_border=True)
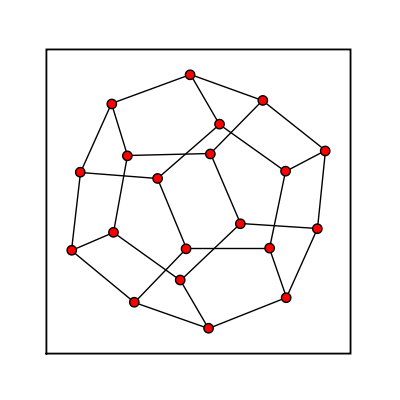
Dodecahedral Graph
sage: dodecahedral = graphs.DodecahedralGraph()
sage: dodecahedral.show(figsize=[4,4], vertex_labels=False, node_size=50, graph_border=True)
Pseudofractal Graphs
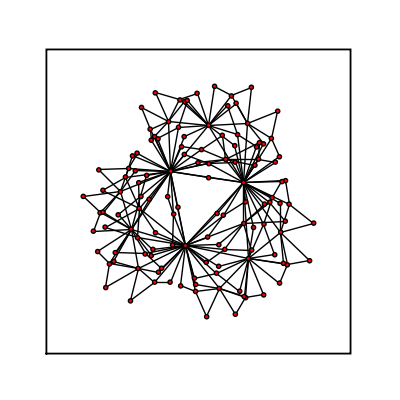
Dorogovtsev Goltsev Mendes Graph
sage: (graphs.DorogovtsevGoltsevMendesGraph(5)).show(figsize=[4,4], graph_border=True, vertex_size=10, vertex_labels=False)
Basic Structures
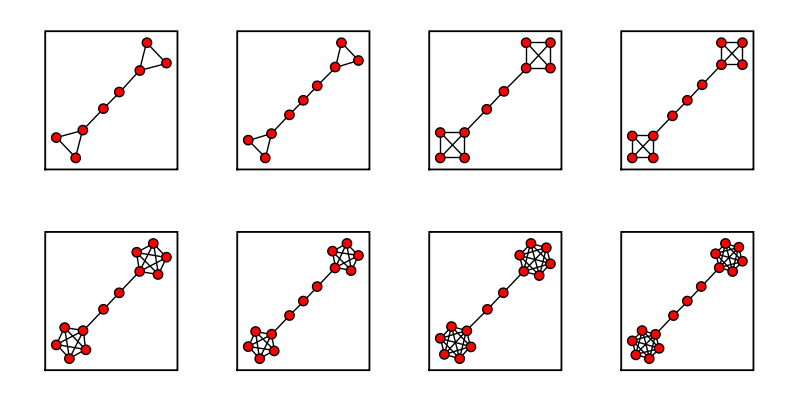
Barbell Graph
sage: barbell_list = []
sage: for i in range (4):
... for j in range (2):
...  barbell_list.append(graphs.BarbellGraph(i+3, j+2))
...
sage: graphs_list.show_graphs(barbell_list)
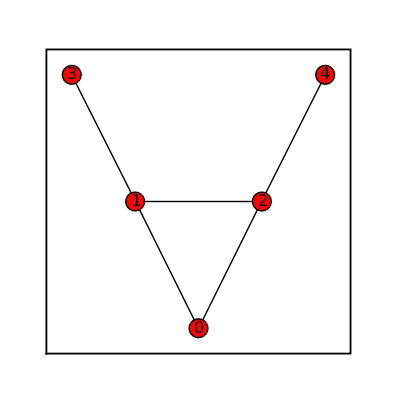
Bull Graph
sage: bull = graphs.BullGraph()
sage: bull.show(figsize=[4,4], graph_border=True)
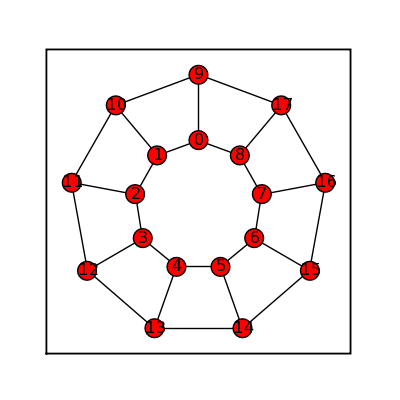
Circular Ladder Graph
sage: circ_ladder = graphs.CircularLadderGraph(9)
sage: circ_ladder.show(figsize=[4,4], graph_border=True)
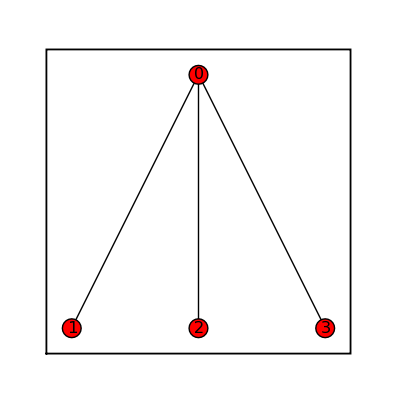
Claw Graph
sage: claw = graphs.ClawGraph()
sage: claw.show(figsize=[4,4], graph_border=True)
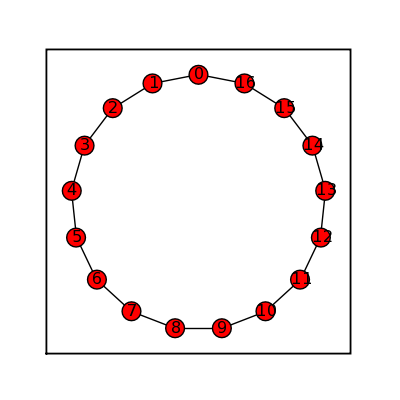
Cycle Graphs
sage: cycle = graphs.CycleGraph(17)
sage: cycle.show(figsize=[4,4], graph_border=True)
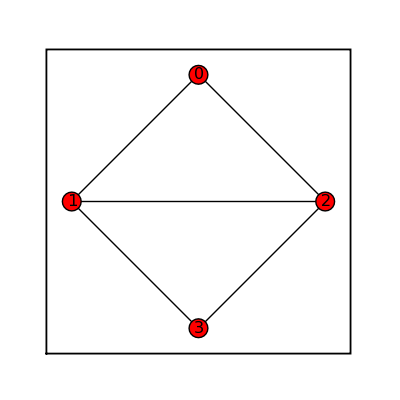
Diamond Graph
sage: diamond = graphs.DiamondGraph()
sage: diamond.show(figsize=[4,4], graph_border=True)
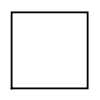
Empty Graph
sage: empty = graphs.EmptyGraph()
sage: empty.show(figsize=[1,1], graph_border=True)
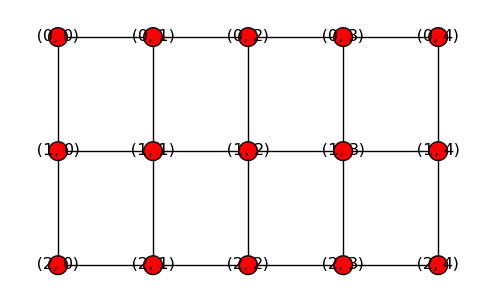
Grid 2d Graph
sage: grid = graphs.Grid2dGraph(3,5)
sage: grid.show(figsize=[5,3])
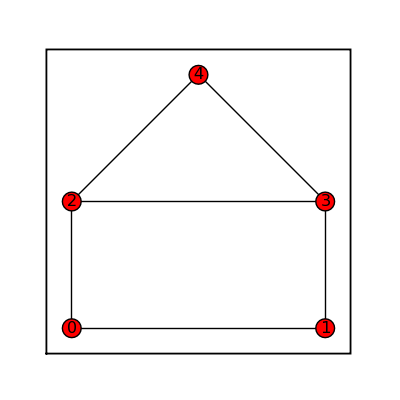
House Graph
sage: house = graphs.HouseGraph()
sage: house.show(figsize=[4,4], graph_border=True)
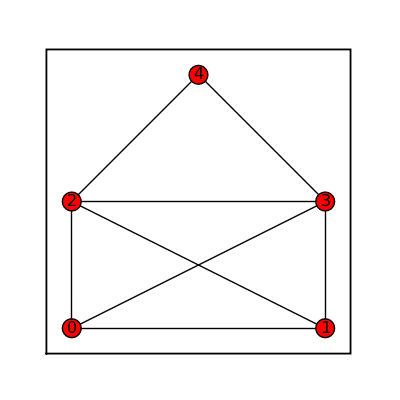
House X Graph
sage: houseX = graphs.HouseXGraph()
sage: houseX.show(figsize=[4,4], graph_border=True)
Krackhardt Kite Graph
sage: krackhardt = graphs.KrackhardtKiteGraph()
sage: krackhardt.show(figsize=[4,4], graph_border=True)
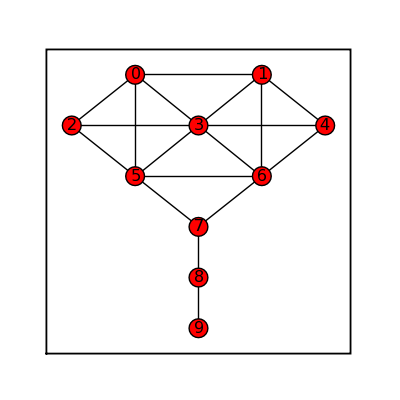
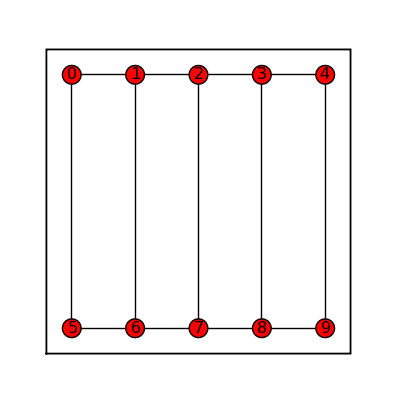
Ladder Graph
sage: ladder = graphs.LadderGraph(5)
sage: ladder.show(figsize=[4,4], graph_border=True)
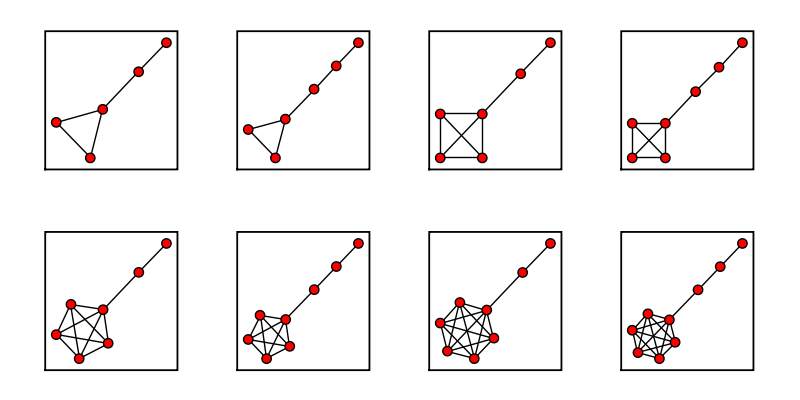
Lollipop Graph
sage: lollipop_list = []
sage: for i in range (4):
... for j in range (2):
...  lollipop_list.append(graphs.LollipopGraph(i+3, j+2))
...
sage: graphs_list.show_graphs(lollipop_list)
Path Graph
sage: path_line = graphs.PathGraph(5)
sage: path_circle = graphs.PathGraph(15)
sage: path_maze = graphs.PathGraph(45)
sage: path_list = [path_line, path_circle, path_maze]
sage: graphs_list.show_graphs(path_list)

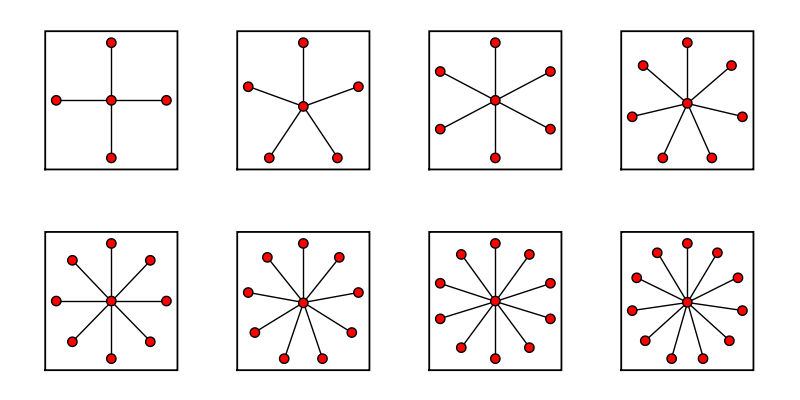
Star Graph
sage: star_list = []
sage: for i in range (12)[4:]:
... star_list.append(graphs.StarGraph(i))
...
sage: graphs_list.show_graphs(star_list)
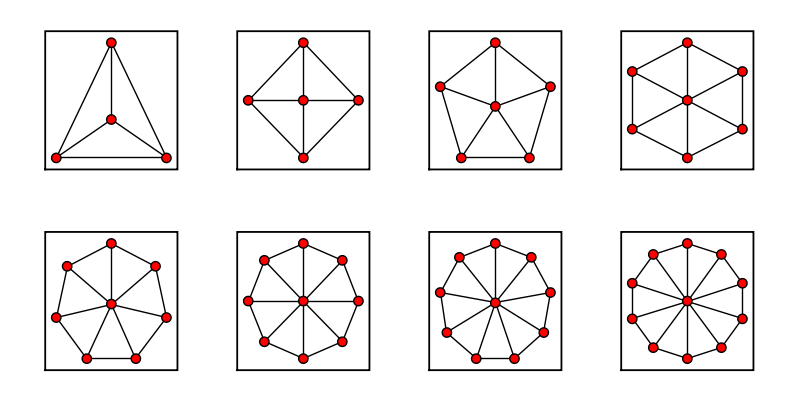
Wheel Graph
sage: wheel_list = []
sage: for i in range (12)[4:]:
... wheel_list.append(graphs.WheelGraph(i))
...
sage: graphs_list.show_graphs(wheel_list)
Random Generators
Random GNP
Use for dense graphs:
time
sage: (graphs.RandomGNP(16,.77)).show(figsize=[4,4], graph_border=True)
My results: CPU time: 0.74 s, Wall time: 0.73 s 
Random GNP Fast
Use for sparse graphs:
time
sage: (graphs.RandomGNPFast(16,.19)).show(figsize=[4,4], graph_border=True)
My results: CPU time: 0.63 s, Wall time: 0.62 s 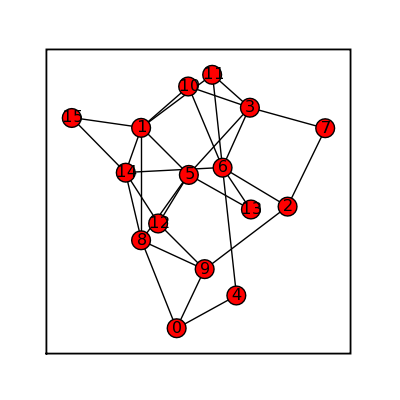
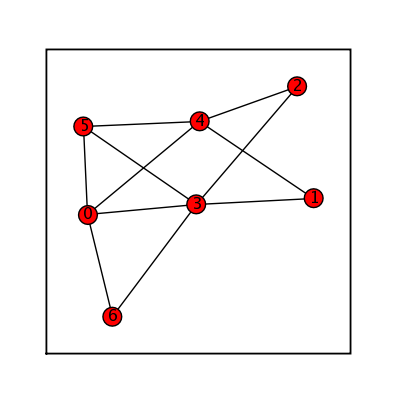
Random Barabasi Albert
sage: (graphs.RandomBarabasiAlbert(7,3)).show(figsize=[4,4], graph_border=True)
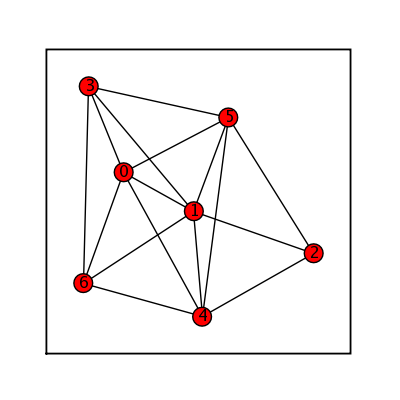
Random GNM
sage: (graphs.RandomGNM(7,16)).show(figsize=[4,4], graph_border=True)
Random Newman Watts Strogatz
sage: (graphs.RandomNewmanWattsStrogatz(7,3,.5)).show(figsize=[4,4], graph_border=True)
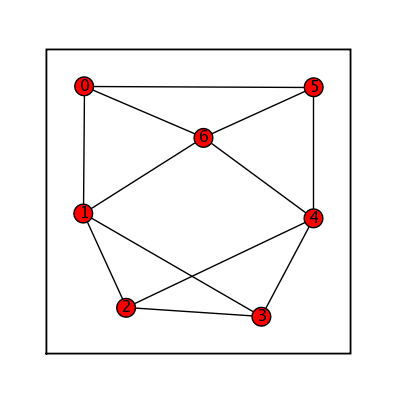
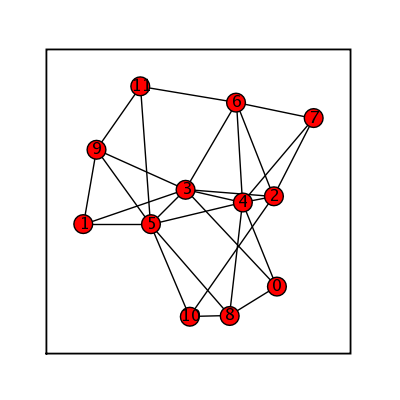
Random Holme Kim
sage: (graphs.RandomHolmeKim(12,3,.4)).show(figsize=[4,4], graph_border=True)
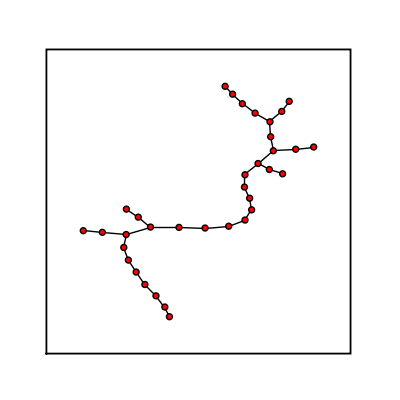
Random Lobster
sage: (graphs.RandomHolmeKim(12,3,.4)).show(figsize=[4,4], graph_border=True)
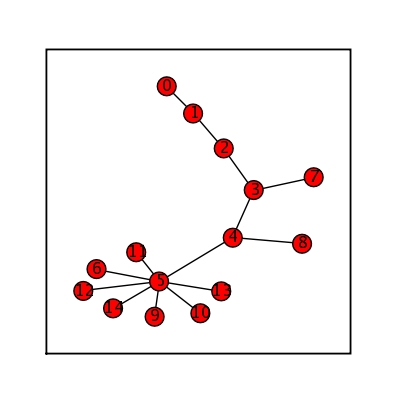
Random Tree Powerlaw
sage: (graphs.RandomTreePowerlaw(15)).show(figsize=[4,4], graph_border=True)
Random Regular
sage: (graphs.RandomRegular(3,20)).show(node_size=20, vertex_labels=False, figsize=[4,4], graph_border=True)
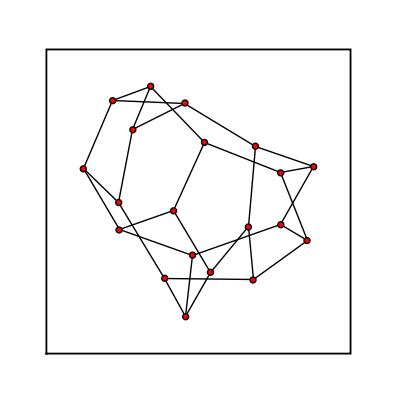
Random Shell
sage: (graphs.RandomShell([(10,20,0.8),(20,40,0.8)])).show(node_size=20, vertex_labels=False, figsize=[4,4], graph_border=True)
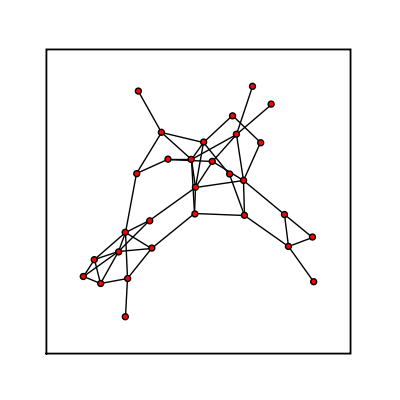
Random Directed Graphs
Random Directed GN
sage: (graphs.RandomDirectedGN(12)).show(node_size=20, vertex_labels=False, figsize=[4,4], graph_border=True)
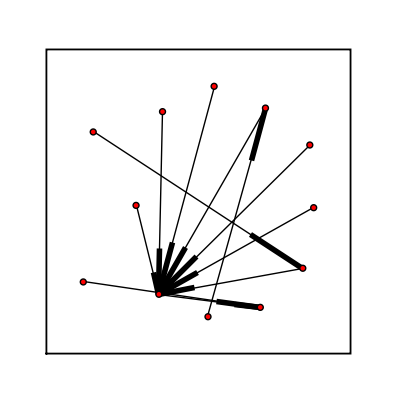
Random Directed GNC
sage: (graphs.RandomDirectedGNC(12)).show(node_size=20, vertex_labels=False, figsize=[4,4], graph_border=True)
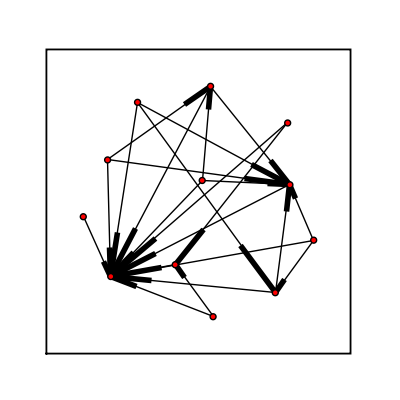
Random Directed GNR
sage: (graphs.RandomDirectedGNR(12,.15)).show(node_size=20, vertex_labels=False, figsize=[4,4], graph_border=True)
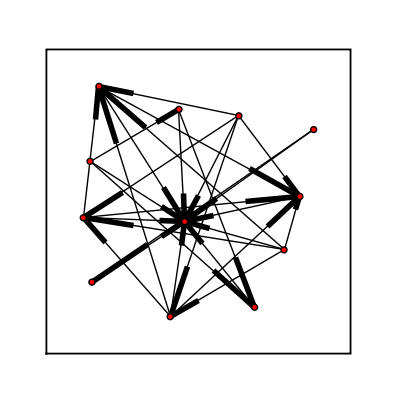
Graphs With a Given Degree Sequence
Degree Sequence
sage: (graphs.DegreeSequence([3,3,3,3,3,3,3,3,3,3,3,3,3,3,3,3,3,3,3,3,3,3])).show(vertex_labels=False, node_size=30, figsize=[4,4], graph_border=True)
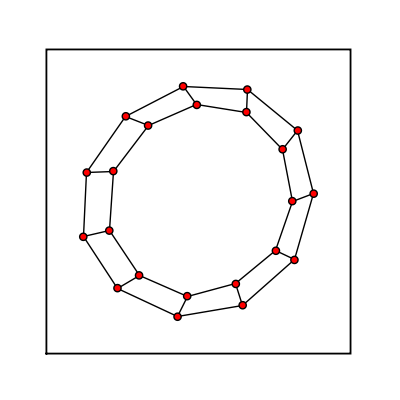
Degree Sequence Configuration Model
sage: (graphs.DegreeSequenceConfigurationModel([3,3,3,3,3,3,3,3,3,3,3,3,3,3,3,3,3,3,3,3])).show(vertex_labels=False, node_size=30, figsize=[4,4], graph_border=True)
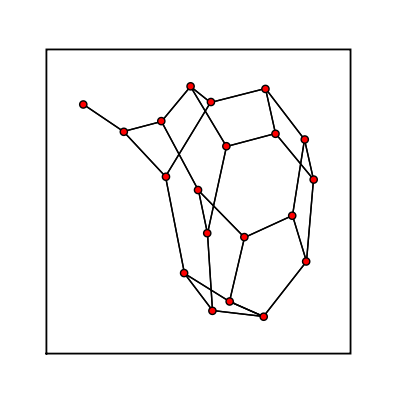
Degree Sequence Tree
sage: (graphs.DegreeSequenceTree([3,1,3,3,1,1,1,2,1])).show(figsize=[4,4], graph_border=True)
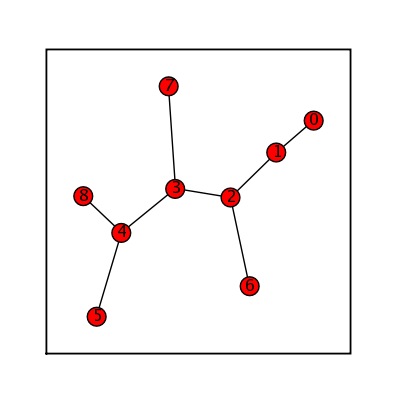
Degree Sequence Expected
sage: (graphs.DegreeSequenceExpected([1,2,3,2,3])).show(figsize=[4,4],graph_border=True)
